Substance Abuse

Variables

  • BINGE DRINKING AMONG ADULTS
  • BINGE DRINKING AMONG MIDDLE AND HIGH SCHOOL STUDENTS
  • ER VISITS AND HOSPITALIZATIONS DUE TO ALCOHOL ABUSE
  • DENSITY OF OFF-SALE ALCOHOL OUTLETS
  • USE OF MARIJUANA, UNAUTHORIZED PAIN MEDICATIONS, AND OTHER DRUGS AMONG MIDDLE AND HIGH SCHOOL STUDENTS
  • MORTALITY DUE TO DRUG USE DISORDERS
  • ER VISITS AND HOSPITALIZATIONS DUE TO DRUG USE
  • OPIOID PRESCRIPTIONS

Overview

  • In 2015, 36 percent of adults in San Francisco self-reported binge drinking on at least one occasion. In 2017, 5.7 percent of high school students reported binge drinking and 0.97% of middle school students reported binge drinking.
  • Hospital admission rates due to alcohol abuse among adults citywide decreased in 2014-2016 from 10.53 to 1.12 per 10,000, but Latinos and Black/African Americans still had the highest rates.
  • The density of off-sale alcohol permits is highest in the Tenderloin, where there are 104.4 licenses per square mile, compared to 16.26 licenses per square mile for the city as a whole.
  • In 2017, 25.65 percent, 10.98 percent, and 10.15 percent of high school students in San Francisco reported they had used Marijuana, unauthorized pain medications, and other drugs (including methaphetamines, inhalants, ecstasy, and cocaine).
  • More than 40 percent of White, Black/African American, and Latino/a high school students as well as more than 10 percent of Black/African American and Latino/a middle school students reported having before used marijuana.
  • The age-adjusted rate of mortality due to drug use disorders decreased from 18.97 per 100,000 in 2015 to 10.58 per 100,000 in 2017. The rate among Black/African Americans over that period was over five times as high as that among other races/ethnicities.
  • Neighborhoods like the Tenderloin and South of Market with large Black/African American populations also have much higher mortality rates due to drug use disorder.

What is it?

​The World Health Organization (WHO) defines substance abuse as harmful or hazardous use of psychoactive substances, including alcohol and illicit drugs. Psychoactive substance use can lead to Substance Use Disorder — a cluster of behavioral, cognitive, and physiological phenomena that develop after repeated substance use, that typically include a strong desire to take the drug, difficulties in controlling its use, persisting in its use despite harmful consequences, a higher priority given to drug use than to other activities and obligations, increased tolerance, and sometimes a physical withdrawal state.[1]

Many factors determine whether someone will start to use or become dependent on drugs or alcohol. Risk factors can increase a person’s chances for abuse, while protective factors can reduce the risk. Risk factors for use among children and adolescents include unstable family relationships; exposure to physical, mental, and sexual abuse; mental illness, early aggressive behavior; poor social skills; poor academic performance; substance use among peers and family members; drug and alcohol availability; involvement with the juvenile justice system; drug experimentation; and poverty.[2, 3] Protective factors include parental monitoring; positive social relationships; academic competence; and anti-drug policies.

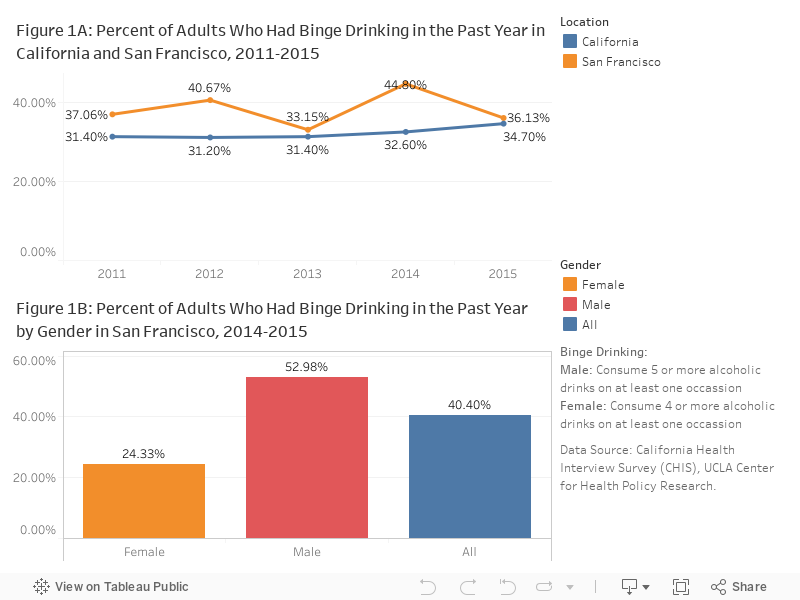
The negative effects of alcohol correlate with increased consumption. Moderate consumption is defined as having up to 1 drink per day for adult women and up to 2 drinks per day for adult men. Excessive alcohol consumption can refer to binge drinking, heavy drinking, drinking by persons under 21 years of age, and any alcohol use by pregnant women. Binge drinking is defined as any consumption leading to a blood alcohol concentration of 0.08% or more or about 4 drinks on a single occasion for adult women, or 5 drinks for adult men. Heavy drinking is defined as consumption of 8 or more drinks per week for women or 15 or more drinks per week for men.[4]


Why is it important for health?

The effects of drug and alcohol use are cumulative, and significantly contribute to costly social, physical, mental, and public health problems. These problems include poor academic performance, cognitive functioning deficits, unintended pregnancy, HIV and other sexually transmitted diseases, motor vehicle crashes, violence, child abuse, crime, homicide, chronic diseases including liver disease and certain cancers (e.g. colorectal, liver, breast, prostate), and mental and behavioral disorders (unipolar depressive disorders, epilepsy, suicide).[5] Unintentional poisoning is now the leading cause of injury death among American adults, surpassing motor vehicle accidents. In 2016, more than 64,000 deaths occurred due to drug overdoses, primarily from heroin and other natural and synthetic opioids.[6] Approximately 88,000 deaths result from alcohol use annually in the U.S. and in 2012 more than 10,000 persons died in alcohol-related motor vehicle accidents alone.[7,8]

Drug and alcohol use are both causes and effects of violence. More than half of all persons arrested for major crimes including homicide and assault were under the influence of drugs at the time of their arrest and over 42 percent of violent crimes reported to the police involved alcohol.[9,10] More than half of all substantiated cases of child abuse and neglect involve substance abuse.[11] Those who experience violence are also more likely to abuse drugs and alcohol. Women who have experienced childhood abuse or neglect are more likely to have problems with alcohol and over two-thirds of patients in drug abuse treatment centers report having been physically or sexually abused as children.[9,12]

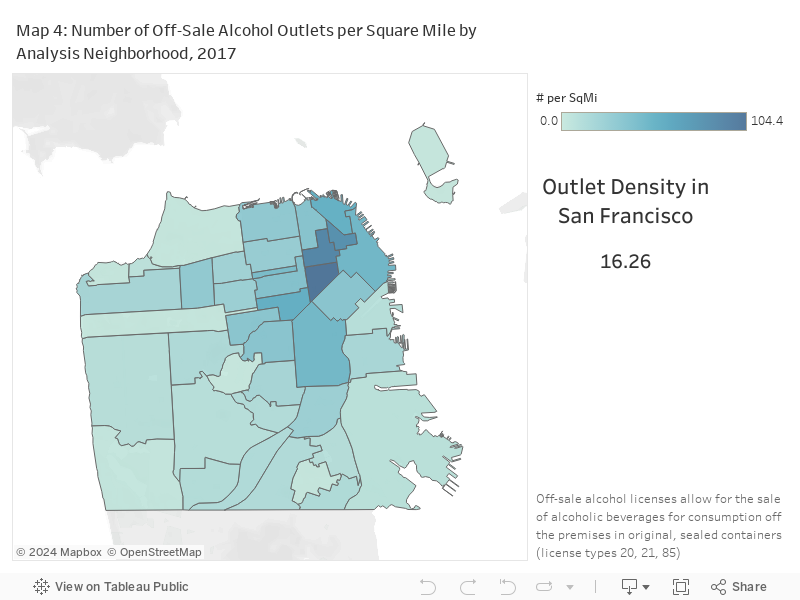
Research suggests that geographic density of alcohol outlets is closely related to crime and violence.[13] One study in New Jersey, controlled for age and poverty, found that neighborhoods with higher densities of alcohol outlets had more violent crimes, including homicide, rape, assault, and robbery.[14] In Los Angeles, a higher density of alcohol outlets was associated with more violence, after controlling for unemployment, age, ethnic and racial characteristics, and other community characteristics.[15] In a six-year study of alcohol outlets in 551 urban and rural zip code areas in California, an increase in the number of bars and off-premise establishments (e.g. liquor, convenience, and grocery stores) was correlated to an increase in the rate of violence.[16] These effects were largest in poor, minority areas of the state, already saturated with the greatest numbers of outlets.

Drug and alcohol have lasting impacts on children exposed intrauterine. Drug use during pregnancy can lead to premature birth, low birth weight, cognitive problems, and substance dependence in the baby.[17] Alcohol use during pregnancy causes fetal alcohol syndrome which includes mental retardation, malformation of the skeleton, heart and brain, and other developmental complications.[18] Children with prenatal exposure to drugs and alcohol are more likely to need special education services in school.

The earlier a person begins to use drugs and alcohol, the more likely he or she is to develop serious problems. The adolescent brain is negatively affected by alcohol and other drugs (e.g., cannabis) through altered function of neurotransmitters, altered perception, and habits and choices associated with drug and alcohol use becoming ingrained.[19] Adolescents exposed to drugs and alcohol before age 15 are more likely to be dependent as adults, to contract a herpes infection, to become pregnant as an adolescent, and to be involved in crime.[20]

Drug and alcohol abuse put the user at increased risk for communicable and chronic diseases. In 2000, one third of AIDS cases in the US resulted from injection drug use; about half of pediatric AIDS cases resulted from injection drug use or sex with an injection drug user by the mother.[21] Nearly all hepatitis C cases are attributable to injection drug use.[22] Alcohol consumption can also lead to high blood pressure, various cancers, heart disease, stroke, and liver disease.[23] Alcohol use has been estimated to cause 3.5% of cancer deaths in the US, with each deaths associated with 17 to 19 years of life lost.[24]


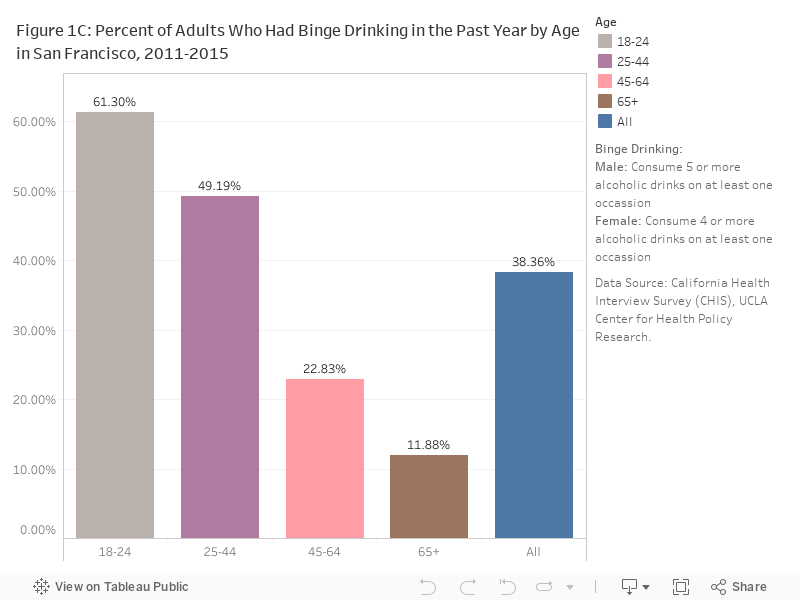
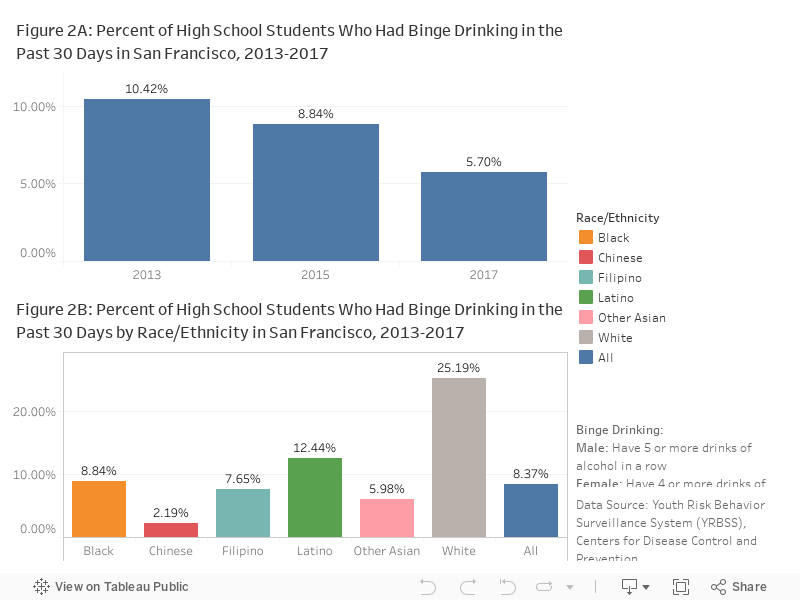
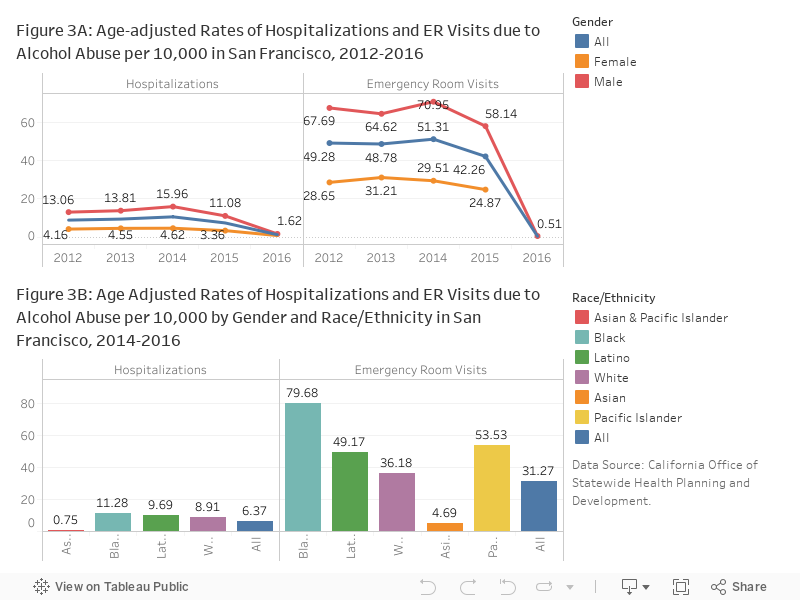
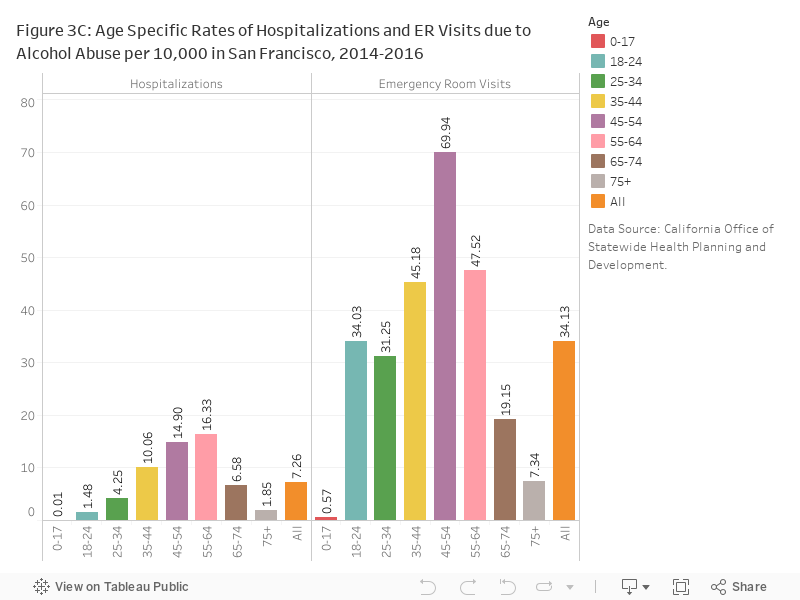
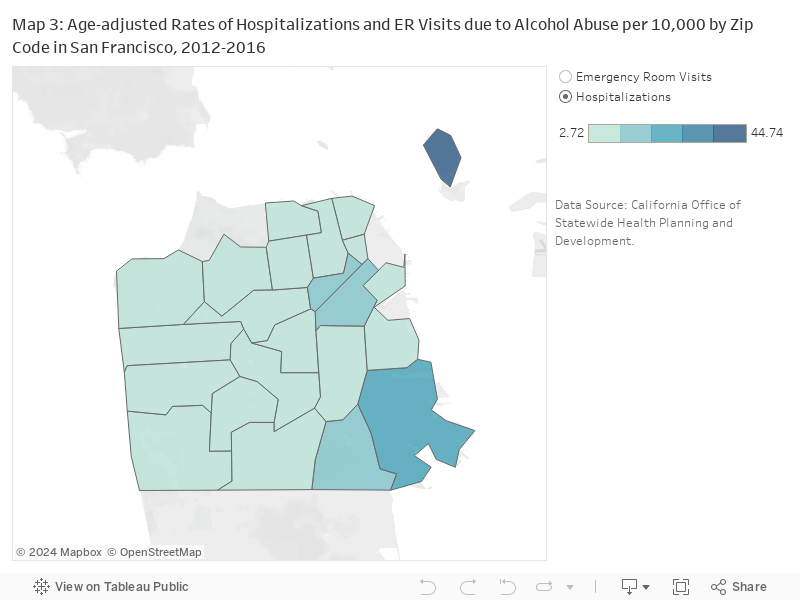
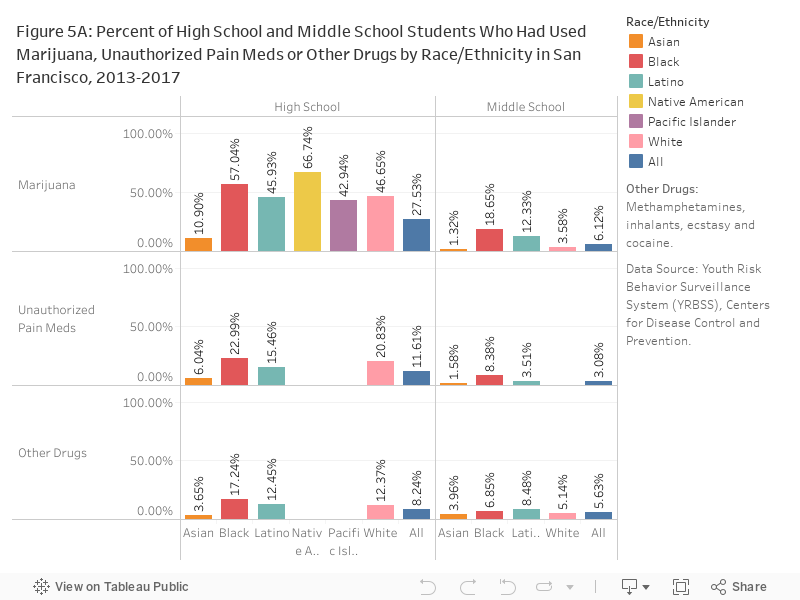
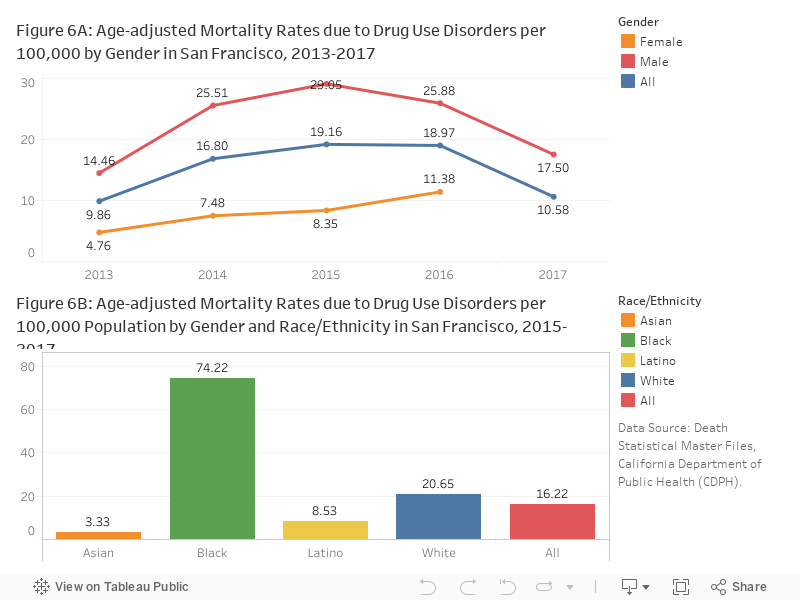
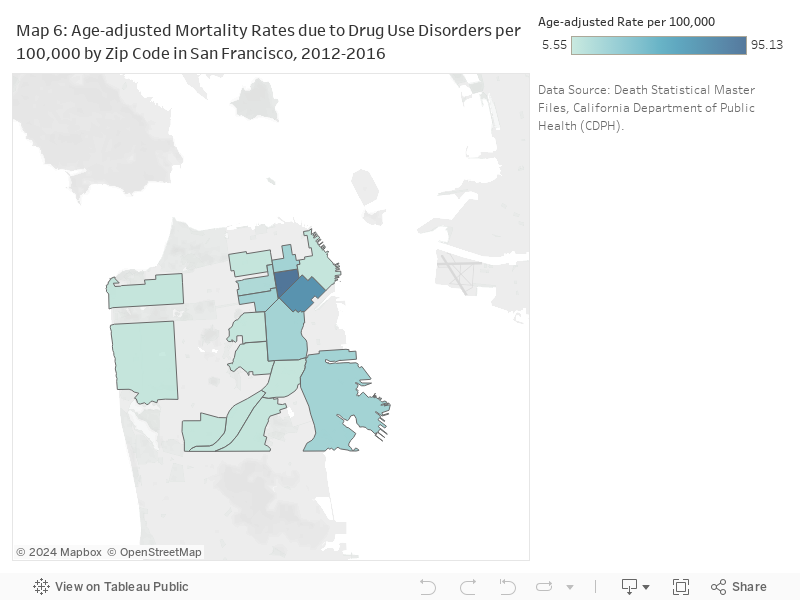
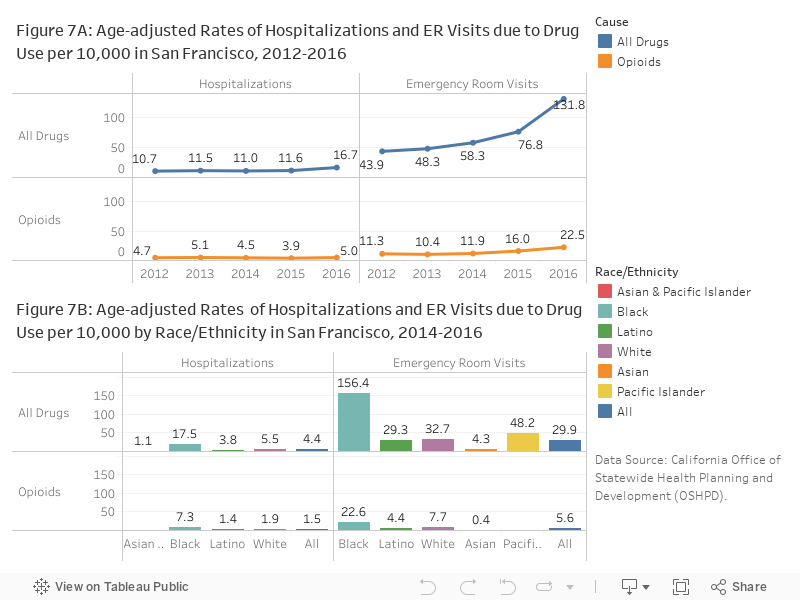
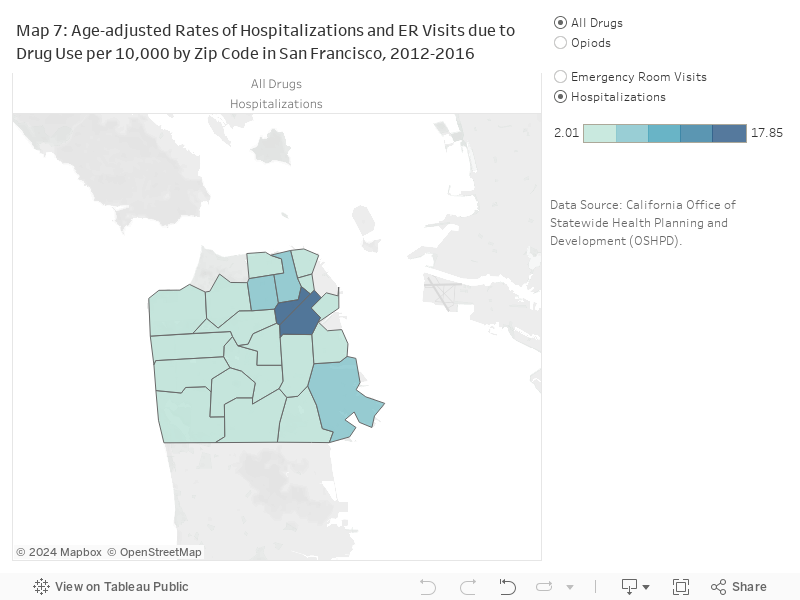
What is the status in San Francisco?

Alcohol abuse: In 2015, 36% of adults in San Francisco self-reported binge drinking on at least one occasion, compared to 35% in California overall (Figure 1A). Men were twice as likely to binge drink as women (Figure 1B), and young adults weremore likely to binge drink than older adults (Figure 1C).

Alcohol abuse can start in middle school. In 2017, 5.7% of high school students in San Francisco reported binge drinking (Figure 2A). The percentage among White high school students was 25%, which was between two and twelve times as high as other race/ethnicities in 2013-2017 (Figure 2B). Limiting youth access to alcohol has reduced underage alcohol use and alcohol-related problems.[8]

Hospital admission and emergency room rates due to alcohol abuse in San Francisco decreased from 2012 to 2016 (Figure 3A). It is possible these decreases are a result of less residents seeking care. Latinos, Black/African Americans, and Pacific Islanders had the highest such rates between 2014 and 2016 (Figures 3B). Although self-reported binge drinking was highest among young adults, emergency room visits and hospitalization rates were highest among adults age 45-64 years, presumably as a result of health issues arising from heavy drinking (Figure 3C). City areas with the highest density of off-sale alcohol outlets coincide with areas with high alcohol-related hospitalization rates (Map 3, 4).

Off-sale alcohol outlets: Drinking and underage drinking are known to vary directly with proximity to liquor stores and pricing. Off-sale alcohol outlets are those authorized by the State of California to sell all types of alcoholic beverages for consumption off premises in original, sealed containers—such as grocery stores, liquor stores, mini-marts, and package stores. This excludes restaurants, bars, and other facilities where alcohol is consumed onsite. Off-sale alcohol permits are either general (for the sale of beer, wine, and distilled spirits) or beer-and-wine-only. Per Section 23817.5 of the California ABC Act, the number of licenses for each permit type is limited to one for every 2,500 inhabitants of a county, or one for every 1,250 inhabitants for both types combined.[13]

A number of neighborhoods, however, have license densities that are far higher, including the Financial District, North Beach, Japantown, Castro/Upper Market, Chinatown, South of Market, and the Tenderloin, which have between two and four licenses per 1,250 residents. The density of permits is by far the highest in the Tenderloin, where there are 104.4 licenses per square mile, compared to 16.26 per square mile for the city as a whole (Map 4). Note that the per capita densities of licenses is only slightly higher in communities of concern like Chinatown or the Tenderloin, due to their high population density.

Drug abuse: In 2017, 25.65%, 10.98% and 10.15% of high school students in San Francisco reported they had used Marijuana, unauthorized pain medications, and other drugs (including methaphetamines, inhalants, ecstasy and cocaine), respectively; the percentages for middle school students were 3.88%, 3.37%, 4.16%, respectively. Ethnic identity correlates drug use among students. More than 40% of White, Black/African American, and Latino high school students as well as more than 10% of Black/African American and Latino middle school students had used marijuana in 2013-2017 (Figure 5A).

In 2017, the age-adjusted mortality rate due to drug use disorder was 10.58 per 100,000, which decreased from 18.97 per 100,000 in 2015 (Figure 6A). The rates among Black/African Americans was five times as high as that of all ethnicities with 74.22 per 100,000 (Figure 6B). Neighborhoods with large Black/African American populations, like the Tenderloin and South of Market, also have much higher mortality rates due to drug use disorder in 2012-2016 (Map 6).

While hospitalization rates due to drug use were stable in 2012-2016, corresponding emergency room visit rates for all drugs increased by 200% and for opioids increased 100% (Figure 7A). Black/African American residents of the Tenderloin and South of Market were more likely to be admitted to hospital or visit the emergency room due to drug use (Figure 7B, Map 7). Pacific Islanders also had higher emergency room visit rate in 2014-2016 (Figure 7B).

In 2017, the opioid prescription rate in San Francisco has decreased to 311.1 per 1,000 residents, much lower than the statewide rate 507.6 per 1,000 residents (Figure 8A). That same year, zip code 94104 area had the highest opioid prescription rate of 1,291 per 1,000 residents in the city (Map 8). Between 2010 and 2012 there were 331 deaths in San Francisco due to accidental overdose of opioids, most commonly involving methadone, morphine, and/or oxycodone. Most of these deaths also involved other substances (cocaine, benzodiazepines, anti-depressants, alcohol).[25] While prescription opioids are becoming a significant concern, one report cautions that reducing access to prescribed opioids may increase the number of young heroin users as well as the number of relapsing former users.[11] In 2013, several lesser known drugs were detected in San Francisco. Cannabimimetics, such as XLR-11, have been found in several driving-under-the-influence and criminal justice cases.[11] Additionally, the San Francisco Police Department reported finding desomorphine and 4-methyl-5-thiazole ethanol–a viscous, oily liquid used as a sedative and hypnotic.

What is currently being done in San Francisco to improve health?


Data Sources

CHIS The California Health Interview Survey (CHIS), UCLA Center for Health Policy Research.
OSHPD Office of State Health Planning and Development (OSHPD).
YRBSS Youth Risk Behavioral Surveillance System (YRBSS), Centers for Disease Control and Prevention.
COOSD California Opioid Overdose Surveillance Dashboard (COOSD).
SFHIP San Francisco Health Indicator Project (SFHIP).


Methods and Limitations

Density of off-sale alcohol outlets: Not all off-sale alcohol outlets are the same type of business. The stores vary in hours open, types of other products or types of alcohol for sale, languages spoken, pricing, and clientele. The presence of a full-service grocery store that also sells alcohol likely has a very different impact on a neighborhood’s access to healthy food resources than the presence of a package or liquor store.
Although there is officially a moratorium on new alcohol outlet licenses in San Francisco, the trading of licenses between businesses does occur and may impact the distribution of alcohol outlets.
More information on the methodology used to compute the density of off-site alcohol outlets is available at the San Francisco indicator project, www.sfindicatorproject.org.

Hospitalizations and Emergency Room Visits:

  • Hospitalization and ER rates measure the number of admissions or visits, but not the number of unique residents hospitalized. Admissions records may include multiple admissions by the same person.
  • ​In October 2015, the diagnosis coding standard for Hospitalizations and Emergency Room visits was changed from ICD-9 to ICD-10. Caution should be used in comparing data using the two different standards.
  • ICD-9/10 codes for alcohol and drug use were obtained from the CDPH Safe and Active Communities Branch.[26]
  • ​Rate estimates for alcohol or drug use as the primary cause were computed by searching only the primary diagnosis field only. Rate estimates alcohol or drug use as the primary, co-morbid, or coexisting cause was computing by searching all available diagnosis fields.

Population estimates for rates:

  • State of California, Department of Finance, Race/Hispanics Population with Age and Gender Detail, 2000–2010. Sacramento, California, September 2012.
  • California Department of Finance. Demographic Research Unit. 2018. State and county population projections 2010-2060 [computer file]. Sacramento: California Department of Finance. February 2017.

Standard Population for age adjustment:

  • Population Projections of the United States by Age, Sex, Race, and Hispanic Origin: 1995 to 2050. U.S. Department of Commerce, Economics and Statistics Administration, BUREAU OF THE CENSUS

Statistical instability: Statistically unstable estimates are not shown in this document. Statistical instability may arise from:

  • few respondents to a survey,
  • small population sizes, or
  • small numbers of affected individuals.

Statistical instability indicates a lack of confidence in an estimates ability to accurately and reliably represent the population. Due to statistical instability, estimates are not available for all age, gender, ethnicity, or other groups.


References

[1] World Health Organization. Substance abuse. http://www.who.int/topics/substance_abuse/en/, 2017.
[2] National Institute on Drug Abuse. Preventing drug use among children and adolescents. http://www.drugabuse.gov/publications/preventing-drug-abuse-among-children-adolescents/chapter-1-risk-factors-protective-factors/what-are-risk-factors, 2003.
[3] National Institute on Drug Abuse. Drugs, brains, and behavior: The science of addiction. http://www.drugabuse.gov/publications/drugs-brains-behavior-science-addiction/drug-abuse-addiction, 2014.
[4] Centers for Disease Control and Prevention. Alcohol and public health: Frequently asked questions. https://www.cdc.gov/alcohol/faqs.htm, 2017.
[5] Centers for Disease Control and Prevention. Alcohol and public health: Fact sheets- alcohol and your health. https://www.cdc.gov/alcohol/fact-sheets/alcohol-use.htm, 2016.
[6] National Institute on Drug Abuse. Overdose death rates. https://www.drugabuse.gov/related-topics/trends-statistics/overdose-death-rates, 2017.
[7] National Institute on Alcohol Abuse and Alcoholism. Alcohol facts and statistics. https://www.niaaa.nih.gov/alcohol-health/overview-alcohol-consumption/alcohol-facts-and-statistics, 2017.
[8] National Highway Traffic Safety Administration. Alcohol impaired driving. http://www-nrd. nhtsa.dot.gov/Pubs/811870.pdf, 2013.
[9] National Institute on Alcohol Abuse and Alcoholism. Alcohol alert. https://pubs.niaaa.nih.gov/publications/aa38.htm, 1997.
[10] C. Horgan. Substance abuse: The nation’s number one health problem: Key indicators for policy. Schneider Institute for Health Policy, Robert Wood Johnson Foundation, 2001.
[11] U.S. Department of Health, National Center on Child Abuse Human Services, and Neglect. Protecting children in substance abusing families, 1994.
[12] A.I. Leschner. Nida probes the elusive link between child abuse and later drug use. https://archives.drugabuse.gov/NIDA_Notes/NNVol13N2/DirRepVol13N2.html, 1998.
[13] San Francisco Indicator Project. Alcohol outlet density. www.sfindicatorproject.org, 2014.
[14] Richard A Scribner, David P MacKinnon, and James H Dwyer. The risk of assaultive violence and alcohol availability in los angeles county. American journal of public health, 85(3):335–340, 1995.
[15] Paul J Gruenewald and Lillian Remer. Changes in outlet densities affect violence rates. Alcoholism: Clinical and Experimental Research, 30(7):1184–1193, 2006.
[16] Dennis M Gorman, Paul W Speer, Paul J Gruenewald, and Erich W Labouvie. Spatial dynamics of alcohol availability, neighborhood structure and violent crime. Journal of studies on alcohol, 62(5):628–636, 2001.
[17] National Institute on Drug Abuse. Health consequences of drug misuse. https://www.drugabuse.gov/publications/health-consequences-drug-misuse/prenatal-effects, 2017.
[18] American Pregnancy Association. Fetal alcohol syndrome; fetal alcohol spectrum disorders. http://americanpregnancy.org/pregnancy-complications/fetal-alcohol-syndrome/, 2017.
[19] Science and Management of Additions. The effects of drugs and alcohol on the adolescent brain. http://www.samafoundation.org/the-effects-of-drugs-and-alcohol-on-the-adolescent-brain.html, 2005.
[20] Candice L Odgers, Avshalom Caspi, Daniel S Nagin, Alex R Piquero, Wendy S Slutske, Barry J Milne, Nigel Dickson, Richie Poulton, and Terrie E Moffitt. Is it important to prevent early exposure to drugs and alcohol among adolescents? Psychological science, 19:1037–1044, October 2008.
[21] Centers for Disease Control and Prevention. Drug-associated hiv transmission continues in the united states,. http://www.cdc.gov/hiv/statistics/overview/, 2002.
[22] Centers for Disease Control and Prevention. Viral hepatitis — hepatitis c information. http://www.cdc.gov/hepatitis/hcv/cfaq.htm, 2016.
[23] Center for Disease Control and Prevention. Preventing a leading risk for death, disease, and injury; at a glance 2016. https://www.cdc.gov/chronicdisease/resources/publications/aag/alcohol.htm, 2015.
[24] David E Nelson, Dwayne W Jarman, Jürgen Rehm, Thomas K Greenfield, Grégoire Rey, William C Kerr, Paige Miller, Kevin D Shield, Yu Ye, and Timothy S Naimi. Alcohol-attributable cancer deaths and years of potential life lost in the United States. American journal of public health, 103:641–648, April 2013.
[25] Adam J Visconti, Glenn-Milo Santos, Nikolas P Lemos, Catherine Burke, and Phillip O Coffin. Opioid overdose deaths in the City and County of San Francisco: Prevalence, distribution, and disparities. Journal of urban health : bulletin of the New York Academy of Medicine, 92:758–772, August 2015.
​[26] California Department of Public Health, Safe and Active Communities Branch, Cause of Injury Definition Codes
2017. https://www.cdph.ca.gov/Programs/CCDPHP/DCDIC/SACB/Pages/EpiCenter/OverviewofICDE9and10codes.aspx