Variables
- SFUSD STUDENTS IN GRADE 5 WITH A MEASURED BODY COMPOSITION OUTSIDE THE FITNESSGRAM “HEALTHY FITNESS ZONE”
- ADULTS WHO SELF-REPORT A BODY MASS INDEX OF 25 KG/M2 OR GREATER WHEN SURVEYED
Overweight and obesity are chronic conditions that are associated with altered metabolism [1-4]. Metabolism is shifted such that the body favors burning carbohydrate, starch or simple sugars instead of fat for energy [1-4]. When fat burning is suppressed, individuals are less likely to burn up the fat that they consume in a given meal in the few hours after that meal, before they eat again at the next meal. The primary mechanism for developing overweight or obesity is the storage of fat left over from meals [5]. Gradually, if fat burning is suppressed over weeks, months, or years, body fat stores increase. Men and women are considered overweight when the body fat percentage reaches 23 percent for men and 32 percent for women. Men and women are considered obese when the body fat percentage reaches 30 percent for men and 40 percent for women [6].
Because altered metabolism and body fatness are difficult to measure directly, various indirect measures have been developed. School districts, nationwide, index child weight status using the Fitnessgram “Healthy Fitness Zone” (HFZ), which combines information about the body mass index with direct skinfold measurements of body fat [7].
The CDC classifies individuals as overweight or obese if they have a body mass index of 25 kg/m² or greater [8]. The body mass index is calculated by dividing a person’s weight in kilograms by the square of height in meters. The body mass index correlates with more direct measures of body fat [9]
The main drivers of overweight or obesity risk are political, economic, cultural and environmental conditions in the community [9]. Factors such as the local cost of living, housing/kitchen facilities, food prices, food subsidies, food labeling policy, and types of foods and drinks available for purchase at all food outlets, define the range of diet options accessible to individuals, and thus determine if people consume fat with starch or sugar. Factors such as transportation policy, price of leisure activities, neighborhood safety, and availability of parks, impact an individual’s opportunity to burn calories. Although an individual person’s genetics, life course, education, skills or behavior (such as conscious dieting, exercise or medication use) do contribute to their metabolism and obesity risk, community-level interventions are more powerful than individual or behavioral interventions to prevent obesity [10, 11].
Factors known to suppress fat burning include the presence of any kind of sugar in the blood, stress or the fight or flight response, increases in particular hormones, such as insulin and cortisol, lack of oxygen, and dehydration [3, 12, 13]. Eating carbohydrates or any kind of starch or sugar results in the presence of simple sugar in the blood as well as increases in insulin in the blood [3]. The experience of stress triggers cortisol and is associated with shallow/rapid breathing [12]. Dehydration triggers cortisol and causes the liver to breakdown the body’s protein and glycogen and transform it into the simple sugar glucose [13]. Given factors known to suppress fat burning, higher risk of overweight or obesity can be expected in communities where the majority of accessible food and beverage options contain fat with starch or sugar, where the environment is stressful, where oxygen is lacking, and/or where drinking water or bathroom facilities are not accessible (People restrict fluid intake if bathrooms are not accessible).
Overweight and obesity are linked to numerous comorbidities that include, but are not limited to, glucose intolerance, insulin resistance, dyslipidemia, altered immune response and altered response to stress and sex hormones, particularly when the excess body fat is stored in the upper body or ‘visceral’ region [14]. Body fat tissue is recognized not only as a site where excess energy derived from food is stored, but also as an endocrine organ. More body fat is associated with the production of bioactive substances, known as adipocytokines or adipokines, which trigger chronic low-grade inflammation and interact with a range of processes in many different organs [15].
Over the long-term, overweight and obesity are associated with greater risk of chronic disease, including high blood pressure, high cholesterol, heart disease, type 2 diabetes, osteoarthritis, breast and colon cancers, sleep apnea, and gynecological problems [16]. Overweight and obesity are associated with increased risk of pain, disability, anxiety, depression, and lower quality of life [16]. Body fatness, indexed by overweight and obesity, is associated with all-cause mortality [17, 18].
Overweight and obesity are associated with increased health risk in adults as well as children. Children outside the Healthy Fitness Zone have potential for future health risk [19].
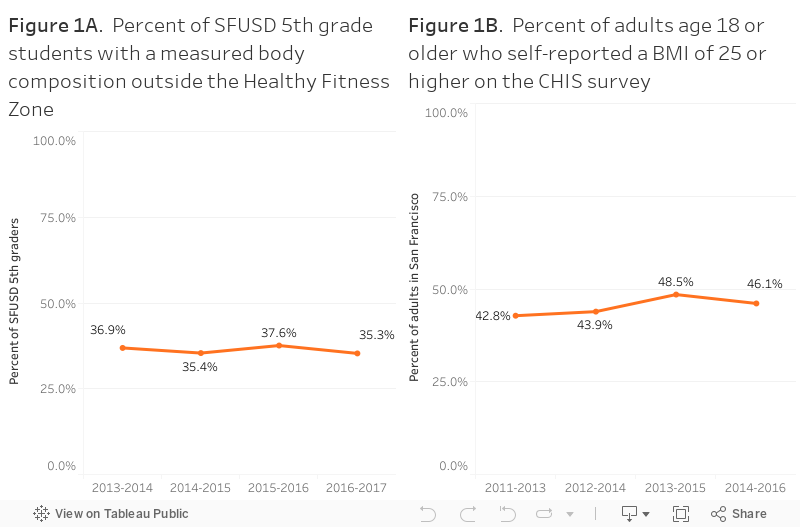
Each year, between 2013-2017, over 30 percent of 5th grade SFUSD students were determined to be outside of the “Healthy Fitness Zone” for body composition measurements (See Figure 1A). In the 2016-2017 academic year, 35 percent of SFUSD students had a body composition outside the healthy fitness zone.
Each year, over the past five years, over 40 percent of adults who responded to the California Health Information Survey (CHIS) self-reported body weight and height values that met CDC criteria for overweight or obesity (See Figure 1B). The proportion self-reporting overweight or obesity did not change significantly over time.
The prevalence of overweight or obesity, although high in San Francisco, is considerably lower than in other places statewide and nationally. In 2014-2016, while almost half of San Franciscan adults (46 percent) self-reported overweight or obesity, two thirds of Californian adults (63 percent) self-reported overweight or obesity. According to National Health and Nutrition Examination Survey data, two thirds (69 percent) of US adults were overweight or obese in 2009-2010.
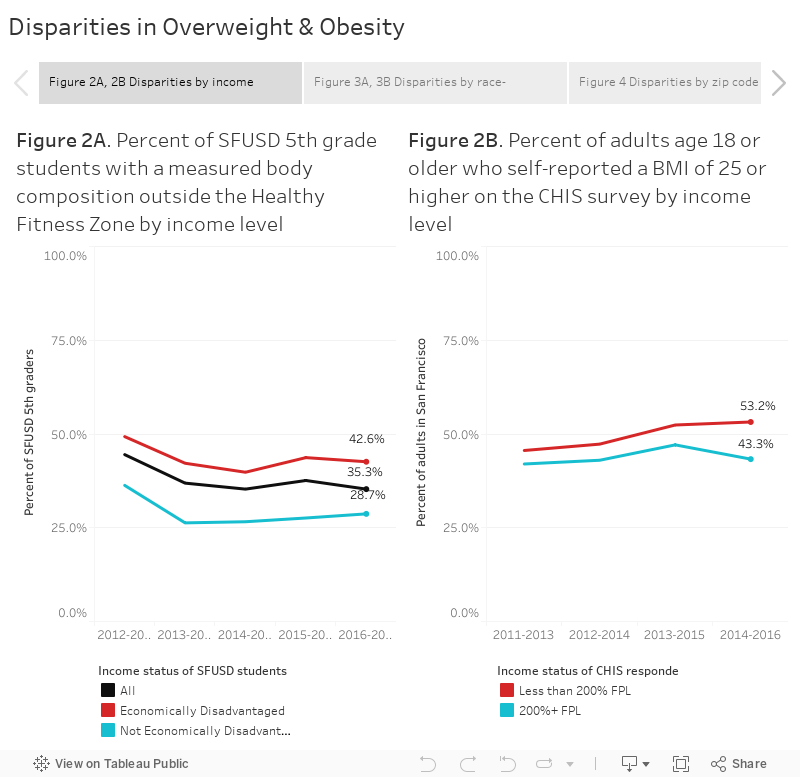
Over the past 5 years, low income children and adults have consistently had higher risk of overweight or obesity.
The risk of having a body composition outside the Fitnessgram Healthy Fitness Zone was about 40 percent higher, each year, for lower income versus higher income SFUSD 5th grade students. In the 2016-2017 academic year, 42.6 percent of 5th grade students who were economically disadvantaged had a body composition outside the Healthy Fitness Zone compared to 28.7 percent of 5th graders who were not economically disadvantaged (Figure 2A).
Among all San Francisco residents, adults with income below 200 percent of the federal poverty line (FPL) were more likely to self-report body measurements in the overweight or obese range than adults with income at or above 200 percent FPL (Figure 2B).
Over the past 5 years, the risk of overweight or obesity consistently varied by race-ethnicity. Among SFUSD 5th graders, in 2016-2017, two-thirds of Pacific Islander and Filipino students and approximately half of Hispanic and Black or African American students had body composition measurements outside the healthy fitness zone, compared to 22 percent of Asian and White students (Figure 3A). Latino and Black/African American adults were more likely to be overweight or obese than Asian or White adults (Figure 3B).
The risk of overweight or obesity was unevenly distributed across San Francisco zip codes (Figure 4).
Obesity among adults is concentrated in parts of Bayview–Hunters Point, Visitacion Valley, the Excelsior, Mission, South of Market, and Tenderloin zip codes.
For individuals with low income, who qualify for subsidized services in San Francisco, such as Preschool For All child care or Medi-Cal insurance, particular community-level factors or aspects of the environment are associated with increased risk of becoming overweight or obese.
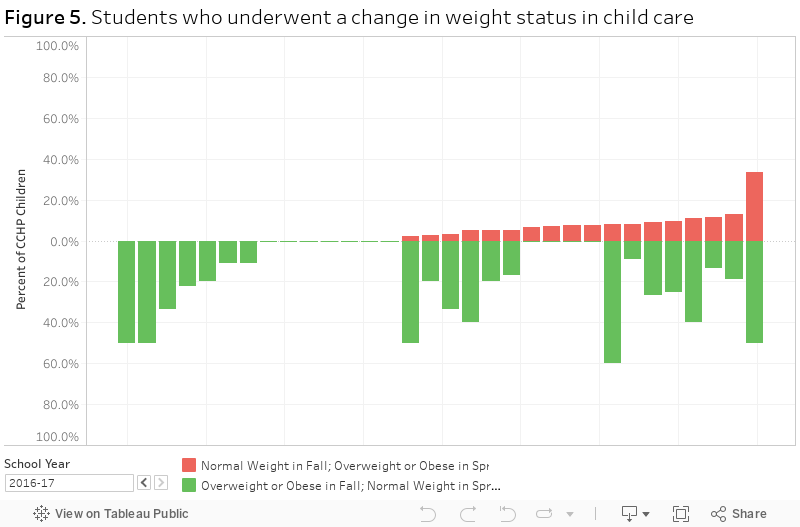
Over the past five years, each academic year, the pattern of weight change experienced by children ages 3 to 4 years who attend subsidized, licensed child care centers has varied (See Figure 5). While, in some child care centers, no (zero) normal weight children have become overweight or obese over the course of the academic year, in other child care centers, as many as 33 percent of children who were normal weight at Fall enrollment became overweight or obese by the following Spring (approximately 6 months later). The relative odds of becoming overweight or obese was associated with various characteristics of the child care center, including not serving drinking water with lunch daily, meals prepared on-site or at a central kitchen as opposed to a professional food vendor, not offering structured dance, zumba, soccer or yoga class, not having staff actively engage in physical activity with children, and not taking children to the neighborhood park [20]. These factors, in turn, were related to child care center policy, funding, staff attitudes and expectations, and facilities/infrastructure [20].
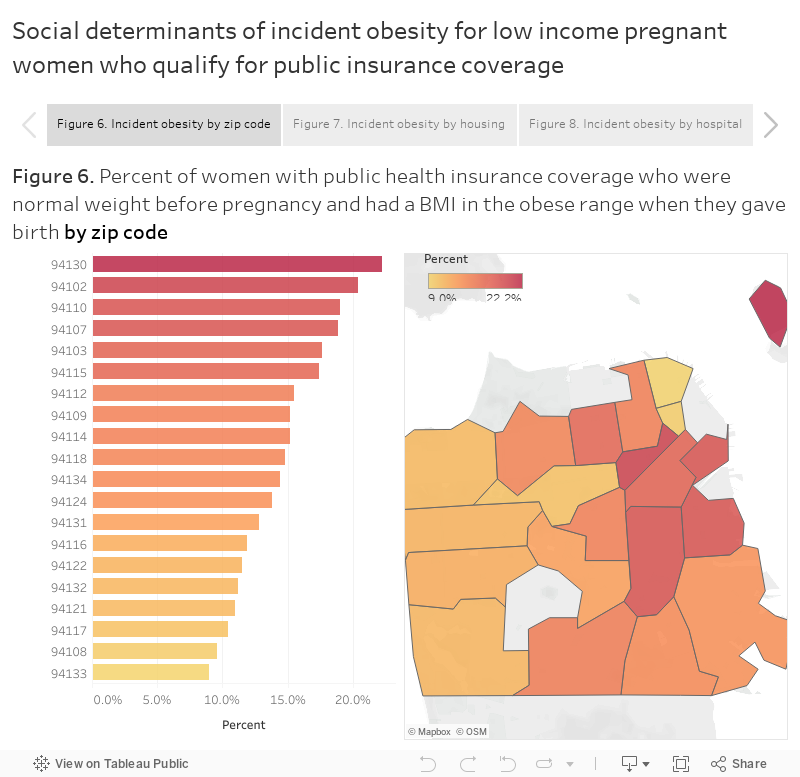
Between 2012-2016, the pattern of incident obesity was unevenly distributed among low income pregnant women who qualified for Medi-Cal or other public insurance coverage for prenatal care. In some zip codes, such as 94133, fewer than 10 percent of the women who were normal weight before pregnancy became obese during pregnancy, while in other zip codes, such as 94130, twice as many initially normal weight women became obese during pregnancy (Figure 6). The incidence of obesity during pregnancy was higher for low income women who gave an address at a single residency occupancy hotel or public housing than for low income women with other housing (Figure 7). The incidence of obesity among low income pregnant women who delivered at St Luke’s or Zuckerberg San Francisco General hospital was double that observed at the California Pacific Medical Center hospital (Figure 8).
It remains to be determined what differences in nutrition and/or physical activity resources explain differences in obesity incidence by type of service or provider.
In the past three years, the San Francisco Health Improvement Partnership (SFHIP) and Our Children Our Families (OCOF) have been working to address childhood overweight or obesity as a key health indicator. The SFHIP Community Health Improvement Plan aimed to improve healthy eating and physical activity resources. OCOF identified SFUSD weight status as a target for citywide collective impact intervention.
The EatSF program provided vouchers to WIC program participants to increase affordability and accessibility of fruit and vegetables (foods low in fat and added sugar). The Sugary Drink Distributor Tax Advisory Committee (SDDTAC) formed to guide interventions to promote drinking water and prevent adverse health effects of sugar-sweetened beverages. Neighborhood taskforces are conducting focus groups to identify, characterize, and address zip-code-specific risk factors, such as food insecurity for pregnant women.
Interventions in public housing and SROs are in progress by SFHOPE and the Food Security Task Force. Hospitals offer food support for patients, such as the Food Pantry at ZSFGH.
Many child care providers in San Francisco have policies in place concerning nutrition and physical activity practices, which help children to develop healthy habits early in life. Some child care providers offer workshops for families to educate parents about weight management for children. Children’s Council of San Francisco sponsors the Healthy Apple Program, providing workshops and coaching to early care educators to aid in implementing best practices to support healthy growth.
CCHP San Francisco Department of Public Health: Child Care Health Program. https://www.sfdph.org/dph/comupg/oprograms/MCH/CCHP.asp
CDE The California Department of Education, FitnessGram® physical fitness test. http://dq.cde.ca.gov/dataquest/
CDPH Birth Statistical Master File. https://www.cdph.ca.gov/Programs/CHSI/Pages/PHPRB.aspx
CHIS California Health Interview Survey. http://askchis.ucla.edu
CHISNE California Health Interview Survey: Neighborhood Edition. http://askchisne.ucla.edu
1. Zurlo F, Lillioja S, Esposito-Del Puente A, Nyomba BL, Raz I, Saad MF, Swinburn BA, Knowler WC, Bogardus C, Ravussin E. Low ratio of fat to carbohydrate oxidation as predictor of weight gain: study of 24-h RQ. Am J Physiol. 1990 Nov; 259(5 Pt 1):E650-7.
2. Kelley DE, Goodpaster BH. Skeletal muscle triglyceride. An aspect of regional adiposity and insulin resistance. Diabetes Care. 2001 May; 24(5):933-41.
3. Edward L Melanson, Paul S. MacLean, James O. Hill. Exercise improves fat metabolism in muscle but does not increase 24-h fat oxidation Exerc Sport Sci Rev. 2009 Apr; 37(2): 93–101. doi: 10.1097/JES.0b013e31819c2f0b https://www.ncbi.nlm.nih.gov/pmc/articles/PMC2885974/
4 . J M Schwarz, R A Neese, S Turner, D Dare, M K Hellerstein. Short-term alterations in carbohydrate energy intake in humans. Striking effects on hepatic glucose production, de novo lipogenesis, lipolysis, and whole-body fuel selection. J Clin Invest. 1995 Dec; 96(6): 2735–2743. doi: 10.1172/JCI118342
PMCID: PMC185982
5. Evan S. Berk, Albert J. Kovera, Carol N. Boozer, F. Xavier Pi-Sunyer, Jeanine B. Albu Metabolic Inflexibility in Substrate Use Is Present in African-American But Not Caucasian Healthy, Premenopausal, Nondiabetic Women J Clin Endocrinol Metab. Author manuscript; available in PMC 2009 Apr 20.
Published in final edited form as: J Clin Endocrinol Metab. 2006 Oct; 91(10): 4099–4106. Published online 2006 Jul 25. doi: 10.1210/jc.2005-2411
6. ACE (2009) What are the guidelines for percentage of body fat loss? American Council on Exercise (ACE). Ask the Expert Blog. December 2, 2009.
Okorodudu; et al. (2010). “Diagnostic performance of body mass index to identify obesity as defined by body adiposity: a systematic review and meta-analysis”. International Journal of Obesity. 34: 791–799. doi:10.1038/ijo.2010.5.
7. http://www.cooperinstitute.org/fitnessgram/standards
8. Centers for Disease Control and Prevention, Division of Nutrition, “Physical Activity, and Obesity. Defining adult overweight and obesity.” http://www.cdc.gov/obesity/adult/defining.html
9. [https://www.cdc.gov/obesity/childhood/defining.html]
10. Hill and Peters, 1998. Hill JO, Peters JC. 1998. Environmental contributions to the obesity epidemic. Science 280(5368):1371–1374. [PubMed]
11. IOM Institute of Medicine (US) Committee on Assuring the Health of the Public in the 21st Century.
Washington (DC): National Academies Press (US); 2002.The Future of the Public’s Health in the 21st Century.https://www.ncbi.nlm.nih.gov/books/NBK221225/
12. https://www.ncbi.nlm.nih.gov/pubmed/27995346
13. https://www.ncbi.nlm.nih.gov/pubmed/18617629
14. Booth
15. Jung & choi 2014 https://www.ncbi.nlm.nih.gov/pmc/articles/PMC4013623/].
16 Grover SA, Kaouache M, Rempel P, Joseph L, Dawes M, Lau DC, Lowensteyn I, “Years of life lost and healthy life-years lost from diabetes and cardiovascular disease in overweight and obese people: a modelling study.” The Lancet Diabetes & Endocrinology, (2015) Feb;3(2):114-22. doi: 10.1016/S2213-8587(14)70229-3. Epub 2014 Dec 5.
17.Abramowitz MK, Hall CB, Amodu A, Sharma D, Androga L, Hawkins M. Muscle mass, BMI, and mortality among adults in the United States: A population-based cohort study. PLoS One. 2018 Apr 11;13(4):e0194697. doi: 10.1371/journal.pone.0194697. eCollection 2018.
18. Lancet. 2016 Aug 20;388(10046):776-86. doi: 10.1016/S0140-6736(16)30175-1. Epub 2016 Jul 13.
Body-mass index and all-cause mortality: individual-participant-data meta-analysis of 239 prospective studies in four continents.
Global BMI Mortality Collaboration, Di Angelantonio E, Bhupathiraju ShN, Wormser D, Gao P, Kaptoge S, Berrington de Gonzalez A, Cairns BJ, Huxley R, Jackson ChL, Joshy G, Lewington S, Manson JE, Murphy N, Patel AV, Samet JM, Woodward M, Zheng W, Zhou M, Bansal N, Barricarte A, Carter B, Cerhan JR, Smith GD, Fang X, Franco OH, Green J, Halsey J, Hildebrand JS, Jung KJ, Korda RJ, McLerran DF, Moore SC, O’Keeffe LM, Paige E, Ramond A, Reeves GK, Rolland B, Sacerdote C, Sattar N, Sofianopoulou E, Stevens J, Thun M, Ueshima H, Yang L, Yun YD, Willeit P, Banks E, Beral V, Chen Zh, Gapstur SM, Gunter MJ, Hartge P, Jee SH, Lam TH, Peto R, Potter JD, Willett WC, Thompson SG, Danesh J, Hu FB.
https://www.ncbi.nlm.nih.gov/pubmed/?term=Body-mass+index+and+all-cause+mortality%3A+Individual-participant-data+meta-analysis+of+239+prospective+studies+in+four+continents
19 [http://www.cooperinstitute.org/fitnessgram/standards].
20 https://www.sfdph.org/dph/files/MCHdocs/Epi/Updates12132016/CNaPA_CCHP_nutrition_screening_presentationDec-1-2016-FINAL-handout.pdf
