Variables
- NUMBER OF MATERNAL DEATHS
- NUMBER OF INFANT DEATHS
- INFANT DEATH RATE
- PREGNANCY-RELATED MORTALITY RATIO
- LEADING CAUSES OF MATERNAL DEATH
- LEADING CAUSES OF INFANT DEATH
Maternal death is defined as the death of a woman during pregnancy or within one year of the end of pregnancy from a pregnancy complication. Pregnancy complications may include any chain of events initiated by pregnancy or the aggravation of an unrelated condition by the physiologic effects of pregnancy [1, 2]. The pregnancy-related mortality ratio is the number of pregnancy-related deaths for every 100,000 live births [2].
Infant death is the death of an infant before his or her first birthday [3]. The infant death rate is the number of infant deaths for every 1,000 live births [3].
Maternal and sudden unexpected infant deaths are considered sentinel events [4]. The U.S. government’s Healthy People targets aim for no more than 3.3 maternal deaths per 100,000 live births [5] and no more than 6.0 infant deaths per live births [6].
The pregnancy-related mortality ratio and infant death rate are often used as indicators of the nation’s health [2, 3]. Factors that affect the health of the entire population can affect mortality among pregnant and postpartum women and infants.
Over the 10 year period 2007-2017, there were 10 maternal deaths due to pregnancy or childbirth. Relative to the 89,594 live births during the decade, the estimated pregnancy-related mortality ratio was 11.2 maternal deaths per 100,000 births. The top 3 causes of maternal death were embolism, infection, and chronic disease, including cancers and hypertension.
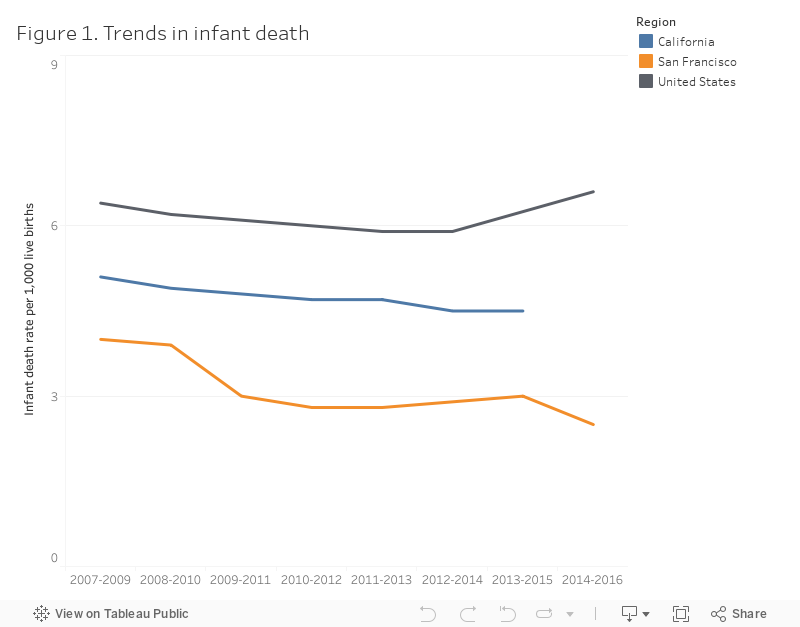
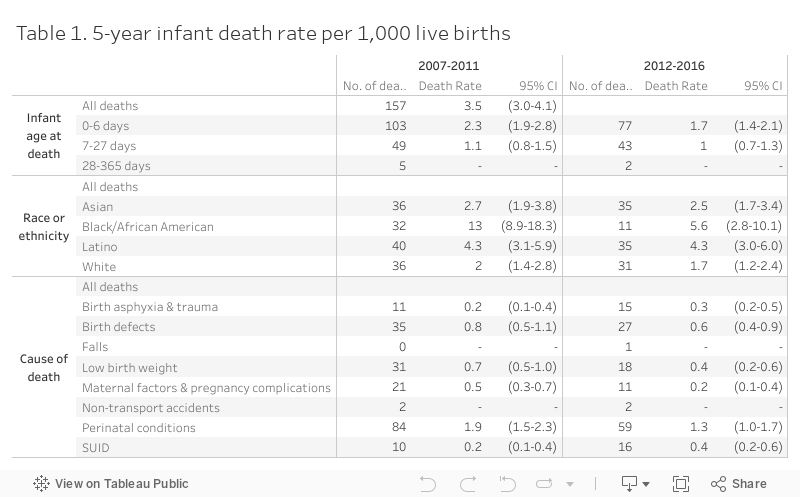
Figure 1 describes trends in infant death in San Francisco. Over the past decade, local infant death rates have consistently been lower than statewide and national rates, and below the Healthy People 2020 target of 6.0 infant deaths per live births [6]. For infants born between 2012-2016, there were about 24 infant deaths per year. The 5-year infant death rate was 2.7 infant deaths per 1,000 births (see Table 1). The top 3 causes of infant death were low birth weight, SUID, and birth trauma. The majority of infant deaths occurred within 7 days of birth.
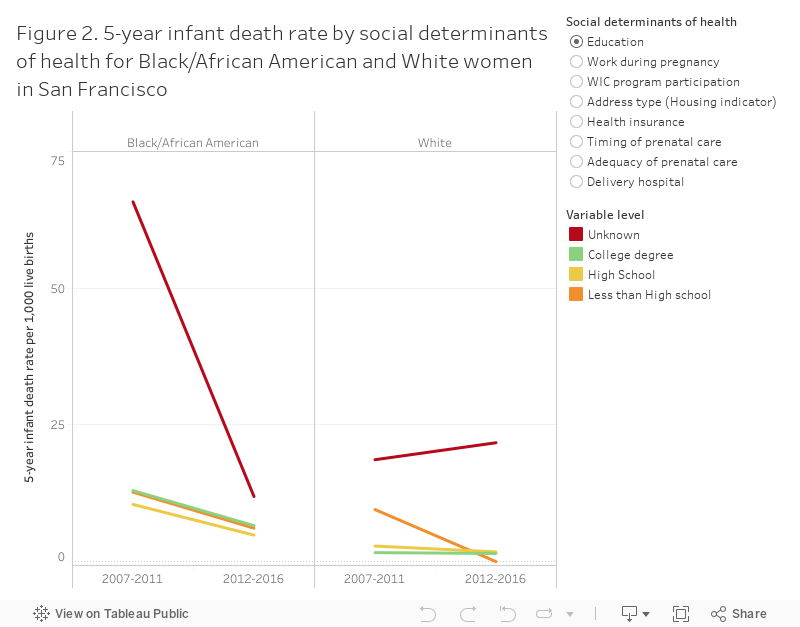
Black/African American women and children have disproportionately experienced maternal death and infant death. Between 2007-2016, Black/African American mothers had about 4 out of 100 births, but experienced 5 out of 10 maternal deaths, and 15 out of 100 infant deaths.
In 2012-2016, 5.6 per 1,000 Black/African American infants died within 12 months of birth, compared to 1.7 per 1,000 White infants (see Table 1). The leading causes of Black/African American infant death were preterm birth (7 out of 11 deaths) and SUID (4 out of 11 deaths). SUID is sudden and unexpected death of a baby less than 1 year old in which the cause is not obvious before investigation. SUID often happens during sleep or in the baby’s sleep area [7].
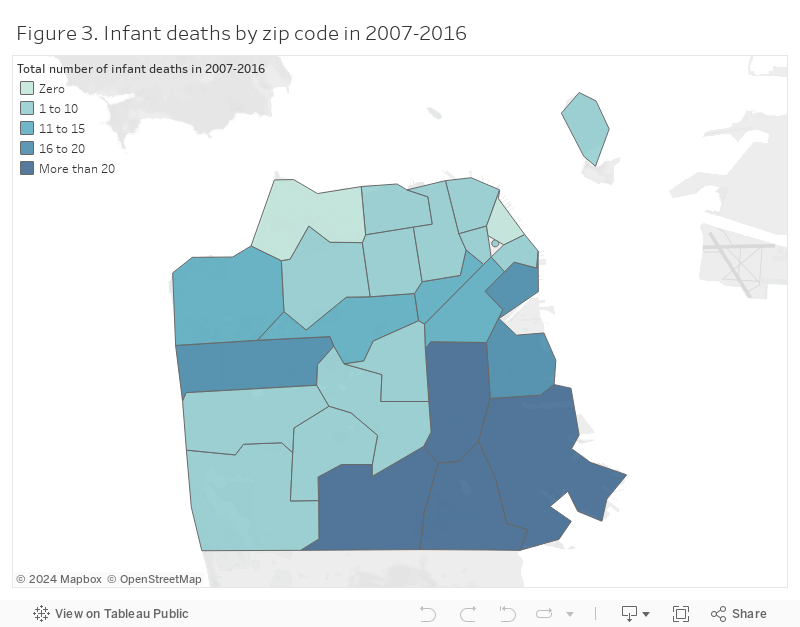
Consistent with uneven distribution of socioeconomic status and services across San Francisco, infant deaths are unevenly distributed across San Francisco zip codes (see Figure 3). Whereas there were zero infant deaths in 10 years in the high income zip code 94129, there were more than 20 infant deaths in the lower income zip code 94124.
Citywide partnerships, strategic plans, and projects, such as the San Francisco Health Improvement Partnership, Our Children Our Families 5-year Plan, and the UCSF Preterm Birth Initiative, aim to reduce maternal and infant health disparities.
The San Francisco Fetal Infant Mortality Review (SF FIMR) program reviews the support services provided to local families who experience a fetal or infant death. SF FIMR reports need for services that reduce stress related to poverty and housing insecurity for pregnant and parenting women, and link women to family planning, preconception, interconception and mental health care, and community resources, such as the Black Infant Health and public health nurse home visiting programs. SF FIMR supports American Academy of Pediatrics (AAP) recommendations to reduce the risk of all sleep-related infant deaths by promoting the Safe to Sleep® campaign, formerly known as the Back to Sleep campaign. Caregivers can visit How to Keep Your Sleeping Baby Safe: AAP Policy Explained for further information.
State of California, California Department of Public Health (CDPH), VRBIS Death Statistical Master File Plus 2005-2017, created on January 30, 2018.
State of California, California Department of Public Health (CDPH), Birth Statistical Master File.
National Center for Health Statistics. Health, United States, 2016: With Chartbook on Long-term
Trends in Health. Hyattsville, MD. 2017. https://www.cdc.gov/nchs/data/hus/hus16.pdf#015. Accessed February 2018.
This report focused on the primary cause of death only. Deaths were classified into mutually exclusive categories based on ICD-10 coded primary cause of death. Categories were developed to be consistent with the WHOs Global Burden of Disease [8].
The maternal death analysis reported here used data obtained from CDPH that were not prepared by the CDC Pregnancy mortality surveillance system. For this reason, the results may underestimate pregnancy-related deaths in San Francisco and/or may not be directly comparable with data from the national CDC Pregnancy mortality surveillance system. The CDC monitors deaths within 1 year of the end of a pregnancy, regardless of the outcome, duration or site of the pregnancy, from any cause related to or aggravated by the pregnancy or its management. For the national CDC Pregnancy mortality surveillance system, medically trained epidemiologists determine the cause and time of death related to the pregnancy, using a cause of death coding system established in 1986 by the American College of Obstetricians and Gynecologists and the Centers for Disease Control and Prevention Maternal Mortality Study Group.
The infant death rates were determined by linking birth records with death records for the same year and following year, to allow for deaths within 12 months of birth. Birth records for 2016 were linked, for example, with death records for 2016 and 2017. Infant deaths are described in terms of the year that the infant was born. Infant death rates and 95 percent confidence limits were not calculated for groups with fewer than 10 deaths. Confidence limits were calculated using factors recommended by the National Center for Health Statistics.
[1] Centers for Disease Control and Prevention. Reproductive Health, Pregnancy-related deaths. https://www.cdc.gov/reproductivehealth/maternalinfanthealth/pregnancy-relatedmortality.htm. Accessed June 2018.
[2] Centers for Disease Control and Prevention. Reproductive Health, Pregnancy Mortality Surveillance System, 3-22-2018. https://www.cdc.gov/reproductivehealth/maternalinfanthealth/pmss.html. Accessed June 2018.
[3] Centers for Disease Control and Prevention. Infant Mortality. https://www.cdc.gov/reproductivehealth/maternalinfanthealth/infantmortality.htm. Accessed June 2018.
[4] Habib J. Sentinel events and severe maternal morbidity. http://www.obgyn.net/pregnancy-and-birth/sentinel-events-and-severe-maternal-morbidity
[5] Preventing maternal death. Joint Commission Issue 44. https://www.jointcommission.org/assets/1/18/sea_44.pdf
[6] Healthy People 2020 Topics & Objectives. Maternal, Infant, and Child Health. Reduce the rate of all infant deaths (within 1 year)(MICH-1.3). https://www.healthypeople.gov/2020/topics-objectives/topic/maternal-infant-and-child-health/objectives. Accessed June 2018.
[7] Centers for Disease Control and Prevention. Sudden Unexpected Infant Death and Sudden Infant Death Syndrome. http://www.cdc.gov/SIDS/. Accessed June 2018.
[8] World Health Organization. The Global Burden of Disease: Update 2004. http://www.who.int/healthinfo/global_burden_disease/2004_report_update/en/. Accessed June 2018.