Healthcare Access and Quality

Variables

  • HEALTH INSURANCE AND SF HEALTH CARE ACCESS PROGRAM PARTICIPATION
  • DELAYED/UNABLE TO OBTAIN NEEDED MEDICAL CARE
  • HAVE A USUAL SOURCE OF MEDICAL CARE
  • CHILD CARE HEALTH PROGRAM COVERAGE
  • TRANSIT ACCESS TO NON-PROFIT HEALTH CARE FACILITIES
  • ETHNIC AND LINGUISTIC MATCH RATIO BETWEEN PHYSICIANS AND RESIDENTS
  • PREVENTABLE EMERGENCY ROOM VISIT
  • PREVENTABLE HOSPITALIZATIONS

Overview

  • The percent of San Franciscans that lack health insurance has fallen dramatically since 2010, to a low of 3% in 2016.
  • Females 18-24, persons earning less than $50k per year, Black and Latino/a residents and persons living in Areas of Vulnerability are more likely to not have health insurance.
  • Adults 25-44 years had a significantly higher rate of delaying medical care compared to adults 65 and over during the 2011-2012 survey period.
  • Outlying neighborhoods, including Lakeshore, Visitacion Valley, and Treasure Island have significantly lower transit access to health care facilities.
  • Asian, Black, and Latio/a physicians are under-represented relative to the San Francisco population.
  • There is a shortage of physicians that speak Chinese and Tagalog based on the linguistic composition of the San Francisco population.
  • Preventable emergency room rates are higher in females than males, and higher for Black and Pacific Islander residents compared to other ethnicities.
  • 94130, 94102, 94103, and 94124 have the highest preventable emergency room rates.

What is it?

Healthy People 2020 defines health care access as the timely use of personal health services.[1] Health care access requires: having the financial means to access health care including health insurance or other coverage, services in locations and at times reachable by those who need them, and services that meet the language and cultural needs of the user. Additionally, trust and respect between health care providers and users and also between the health care systems and the user is essential both in accessing services and assuring the quality of services provided.

Health insurance is a type of insurance coverage that covers the cost of an insured individual’s medical and surgical expenses. Healthy SF is a program operated by the San Francisco Department of Public Health that is designed to make health care services available and affordable to SF residents who do not have health insurance regardless of immigration status, employment status, or pre-existing medical condition. [4] The San Francisco Health Plan (SFHP) is a licensed community health plan that provides health care coverage to low and moderate-income families. [5]

The SF Health Network (SFHN) comprises the direct health services provided by the San Francisco Department of Public Health to insured and uninsured residents of San Francisco. Services provided include primary care clinics, behavioral health services; dental care; acute care; skilled nursing care, and other home- and community-based services. [4]


Why is it important for health?

​Access to health care affects physical, social, and mental health. Health care can prevent disease and disability, detect and treat illnesses, maintain quality of life, delay death, and extend life expectancy. Pre-pregnancy health care for young adults is particularly important as it can reduce rates of unintended pregnancy, poor birth outcomes, and lifetime disease risk for both mother and child. Regular access to quality health care and primary care services also reduces the number of unnecessary emergency room visits and hospitalizations.


What is the status in San Francisco?

Health insurance coverage: In 2016, only 3.3% of San Franciscans lacked health insurance, and another 1.64% were enrolled in a citywide health access program (Healthy SF, Healthy Kids) (Figure 1). There was a dramatic decrease in the percent of San Francisco’s population that was uninsured from 12% to 3% between 2010 and 2016. Similarly, there was a significant decline in the percent of residents enrolled in San Francisco’s health access programs began in 2014. These two decreases can likely be attributed to improving econic conditions after the Great Recession and the implementation of the Affordable Care Act (ACA). ACA greatly increased access to health insurance through two provisions that became effective January 1, 2014:
1) expanded Medicaid eligibility to include all individuals earning below 138% of the federal poverty level (FPL), and
2) federal subsidies for those earning up to 400% FPL to buy insurance on the new health insurance marketplaces. [2]
Accordingly, over 97,000 San Franciscans gained insurance in 2014, with nearly 41,000 enrolling in plans through Covered California, and another 56,000 newly enrolling in Medicaid. Coinciding with the increase in insurance enrollment, Healthy San Francisco participation dropped by nearly 60 percent by the end of 2014. [5] Decreasing enrollment in this program indicates more people gaining health insures through other means.

When health insurance coverage is stratified by age and gender, we can see that young adults are the most likely to be without health insurance as of 2016 (Figure 2). Females, 18-24 are more likely to lack health insurance than any other female age group. For males, there are no significant differences between age groups or when compared to females. By income group, people earning under $50,000 per year are the least likely to have health insurance, compared to higher income groups (Figure 3). In general, the more money people make, the more likely they are to be insured. By ethnicity, Latino/a and Black residents are the most likely to lack health insurance (Figure 4). By neighborhood, Treasure Island, Tenderloin, Mission, Portola, Excelsior, and OMI have the highest percentage of residents without health insurance, as estimates for 2012-2016 are all above 10% (Figure 5). Parts of the city that are designated as Areas of Vulnerability (AOV) have twice the rate of uninsured residents as the rest of the city (Figure 6).

Access to health care: Health insurance is an important measure of access and affordability of health care; however, there are other factors that impact access to necessary medical care. Between 2017 and 2016, between 10-16% of adult residents reported that they had delayed need medical treatment (Figure 7). There were no significant variations over that time period. However, persons 25-44 had a significantly higher rate of delaying medical care compared to persons 65 and over during 2011-2012. Also during 2007-2016, between 84-88% of adult residents reported having a usual source of medical care (Figure 7). Again, there were no significant variations over time. Females had a significantly higher rate of usual care source in survey period 2013-2014. By age, persons 18-24 had a significantly lower rate of usual care source in 2007-2009 and 2013-2014 compared to persons 65 and older.

Child care offers a unique opportunity to reach children in the community and ensure that they have necessary health screenings and treatment. San Francisco’s Child Care Health Program provides health screening in targeted neighborhoods. The program had its highest percentage of children with a physical exam during the 2012-2013 school year, but that percent declined during subsequent years (Figure 8). However, the exam rate seems to have been increasing in recent years.

Another factor that influences access to health care services is transportation. During 2012-2016, roughly 30% of San Francisco households did not have a personal vehicle (see transportation data page). These residents must rely on transit, walking, biking, ride sharing, and other forms of transportation to get to their destinations. Figure 9 illustrates the relative access to non-profit health care facilities, using transit, across San Francisco. Due to both the density of health care service and transit options in the northeast quadrant of the city, health care transit access is the highest in the Tenderloin, SOMA, Hayes Valley, Western Addition, and Castro/Upper Market neighborhoods. The neighborhoods with the lowest health care transit access include Lakeshore, Treasure Island, Seacliff, Lincoln Park, Visitacion Valley, and Sunset/Parkside.

Lastly, patients may feel more or less likely to seek medical care when there is an ethnic of linguistic match. The 2013 Physician Survey by the Medical Board of San Francisco showed that there are a higher percentage of White and other race physicians compared to the population overall (Figure 10). Asian, Black, and Latino/a physicians were under-represented relative to the resident population composition. Linguistically, there is a notable shortage in the percent of physicians that speak Chinese and Tagalog relative to the resident population, while there is a higher percentage of physicians that speak Spanish than the population overall (Figure 10).

Preventable emergency room visits: High rates of preventable emergency room visits can be considered an indication of inadequate access to primary care. Between 2015-2016 the preventable emergency room rate per 10,000 residents was 265 (Figure 11). The rates are higher for adults than youth and higher in females than males. Rates are the highest for Black and Pacific Islander residents compared to White, Latino/a and Asian residents. The zip codes with the highest preventable emergency room rates are 94130 (Treasure Island), 94102 (Tenderloin), 94103 (SOMA), and 94124 (Bayview) for both adults and youth (Figure 12).

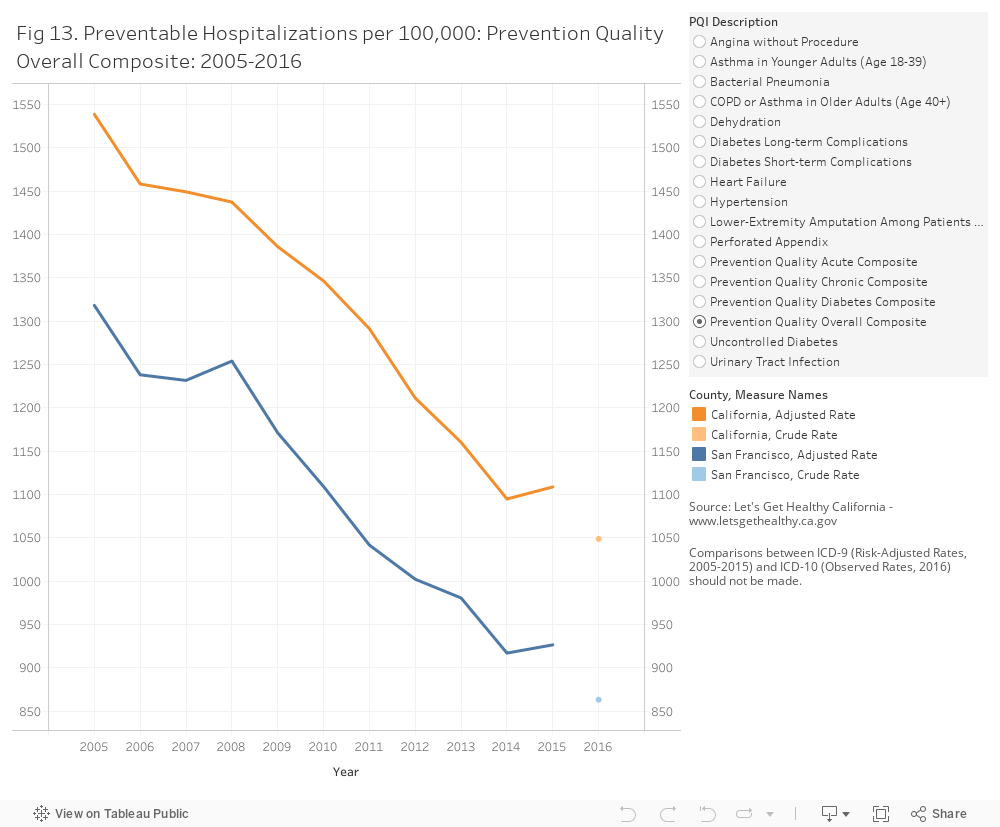
Preventable Hospitalizations: Preventable hospitalizations are those which can be prevented through access to high quality outpatient care. In 2016, the un-adjusted rate of preventable hospitalizations in San Francisco was 863 per 100,000 residents (Figure 13). Rates in San Francisco are consistently below that seen statewide. Since 2005, rates have been declining in San Francisco and Statewide .


What is currently being done in San Francisco to improve health?


Data Sources

ACS American Community Survey. https://www.census.gov/programs-surveys/acs/
CHIS UCLA Center for Health Policy Research, “California Health Interview Survey.” http://ask.chis.ucla.edu/main/default.asp
SFDPH San Francisco Department of Public Health
OSHPD Office of Statewide Health Planning and Development. http://www.oshpd.ca.gov/
Lets Get Healthy California. https://letsgethealthy.ca.gov/goals/redesigning-the-health-system/reducing-preventable-hospitalizations/


Methods and Limitations

Preventable Hospitalizations and Emergency Room Visits:
Hospitalization and ER rates measure the number of admissions or visits, not the number of residents who are hospitalized. Admissions records may include multiple admissions by the same person.

Preventable hospitalizations were analyzed by Let’s Get Health California. Data for 2015 are reported for nine months only due to a coding change from ICD-9 to ICD-10, which began October 1, 2015. ICD-9 comparisons across years should be made with caution since 2011-2014 results are based on 12 months of data, while 2015 rates are based on 9 months of data. Comparisons between ICD-9 (Risk-Adjusted Rates, 2005-2015) and ICD-10 (Observed Rates, 2016) should not be made.

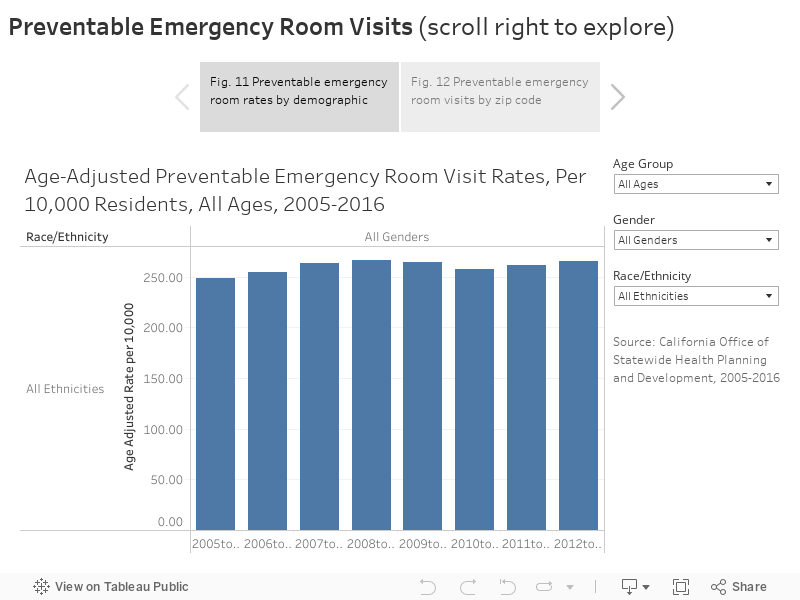
Preventable Emergency room visits were identified by searching the primary diagnosis field for ICD-9 and ICD-10 codes. ICD-9 codes associated with preventable emergency room visits were obtained from a report, “Statewide collaborative quality improvement project reducing avoidable emergency room visits, Final Remeasurement Report: January 1, 2010-December 31, 2010”, published by the California Department of Health Care Serivces, Medi-Cal Managed Care Division [6]. ICD-10 codes were obtained from a report published by the Oregon Health Authority, Ambulatory Care: Avoidable Emergency Department Visits [7] In October 2015, the diagnosis coding standard for Hospitalizations and Emergency Room visits was changed from ICD-9 to ICD-10. Caution should be used in comparing data (Pre 2015 and post 2015) using the two different standards.

​Statistical instability: Statistically unstable estimates are not shown in this document. Statistical instability may arise from:
…few respondents to a survey,
…small population sizes, or
…small numbers of affected individuals.
Statistical instability indicates a lack of confidence in an estimates ability to accurately and reliably represent the population. Due to statistical instability, estimates are not available for all age, gender, ethnicity, or other groups.

​Areas of Vulnerability: Areas of Vulnerability (AOV) were created as a way to examine geographic data in relation to populations of concentrated socioeconomic disadvantage. The criteria to be designated as an AOV were:
1) Top 1/3rd of tracts for < 200% poverty or < 400% poverty & top 1/3rd for persons of color OR
2) Top 1/3rd of tracts for < 200% poverty or < 400% poverty & top 1/3rd for youth or seniors (65+) OR
3) Top 1/3rd of tracts for < 200% poverty or < 400% poverty & top 1/3rd for 2 other categories (unemployment, completing high school or less, limited English proficiency persons, linguistically isolated households, or
disability)
Tracts that had unstable data for an indicator were automatically given zero credit for that indicator.


References

[1] 2020 Healthy People. Access to health services. http://www.healthypeople.gov/2020/topics-
​ objectives/topic/Access-to-Health-Services, 2017.
[2] U.S. Department of Health and Human Services. About the affordable care act.
http://www.hhs.gov/healthcare/rights/, 2017.
[3] San Francisco Department of Public Health. Healthy san francisco. http://healthysanfrancisco.org/.
[4] San Francisco Department of Public Health. San francisco health network. http://www.sfhealthnetwork.org.
[5] San Francisco Health Plan. http://www.sfhp.org/.
​[6] California Department of Health Care Services. Statewide collaborative quality improvement project reducing
avoidable emergency room visits, final remeasurement report: January 1, 2010-december 31, 2010.
http://www.dhcs.ca.gov/dataandstats/reports/Documents/MMCD_Qual_Rpts/EQRO_QIPs/CA2011-
12_QIP_Coll_ER_Remeasure_Report.pdf, June 2012.
[7] Oregon Health Authority. Ambulatory care: Avoidable emergency department visits.
http://www.oregon.gov/oha/HPA/ANALYTICS/CCOData/Ambulatory%20Care%20-
%20Avoidable%20Emergency%20Dept%20Utilization%20-%202016.pdf, April 2017.