Variables
- Asthma among Adults
- Asthma among High School and Middle School Students
- Asthma among Low Income Children in Childcare
- Asthma Hospitalizations
- COPD Hospitalizations
Asthma and chronic obstructive pulmonary disease (COPD) are chronic conditions affecting the airways. COPD, which is an umbrella term for airway diseases such as chronic bronchitis and emphysema, was the third leading cause of death in the United States in 2011.[1] Asthma is the leading chronic condition for children and affects an estimated 10 percent of the United States population.[2] Both conditions are characterized by chronic inflammation of the airways, which may result in coughing, wheezing, and shortness of breath. They can also be exacerbated by environmental conditions and exposures to substances such as tobacco smoke, cold air, allergens, and pollution. Chronic stress in childhood is associated with higher risk of asthma potentially by increasing the impact of traffic related air pollution. [3]
Asthma generally presents during childhood, while COPD is usually diagnosed in persons 40 and older. [4] The obstruction caused by asthma is considered reversible, whereas COPD is irreversible. [2] Asthma does not manifest uniformly in all who have the disease and new research has identified at least 9 types (phenotypes). Each asthma type requires unique approaches to treatment and prevention of episodes. [5]
While the exact causes of asthma are still unknown, current medical opinion is that genetics and environmental exposures play a role in the development of the condition. Persons with a family history of asthma or exposure to allergens and pollutants (such as tobacco smoke, ozone, or particulates) at an early age are at a higher risk of developing asthma.[6] The most common cause for COPD is tobacco smoke (first and second hand). Exposure to fumes and chemicals (generally in an occupational setting) may contribute to the development of COPD as well. [4] Asthma may also be a risk factor for COPD; children who have severe asthma are 32 times more likely that those with mild asthma to have COPD as adults. [2]
Climate change may modify exposure to the allergens and pollutants that increase risk for asthma and COPD. For example, extreme heat accelerates the creation of ground level ozone and other fine particulates that can trigger asthma, while flooding from sea level rise and extreme precipitation events causes household dampness and increases exposure to molds. [7]
Asthma continues to be a major public health concern with a continually increasing prevalence. In 2011, it was estimated that approximately 26 million Americans have asthma, compared with only 20 million in 2001. Asthma is also a cause of lost productivity in adults and children, costing the nation roughly $56 billion annually in healthcare expenses. [8]
COPD is the third leading cause of death in the nation. Additionally, it was estimated in 2010 that COPD-related expenses cost the nation approximately $49.9 billion annually. Death rates due to COPD are typically higher among males than females. [9]
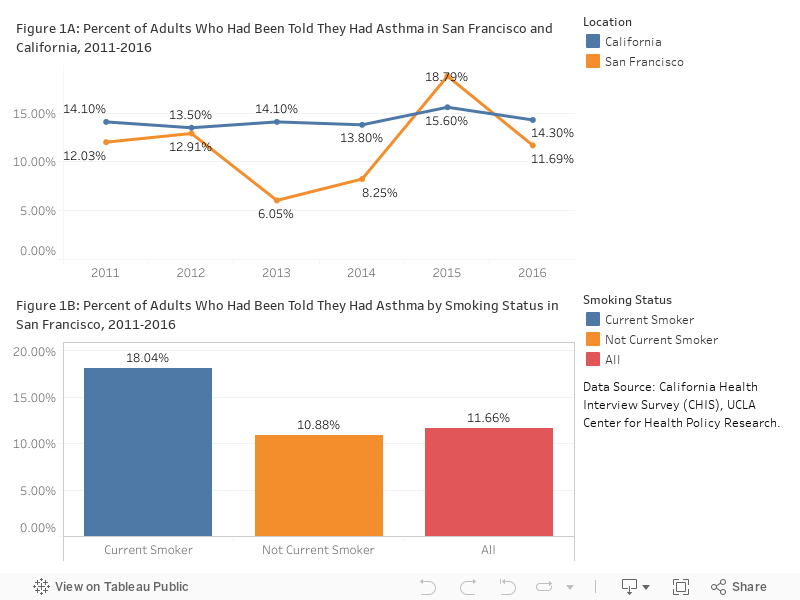
Asthma: The percentage of adults in San Francisco reporting having asthma has hovered around 12% since 2011 (Figure 1A). The prevalence of asthma is highest among cigarette smoking adults (18 %) who are 63% more likely to report having asthma than non-smokers (11%) (Figure 1B).
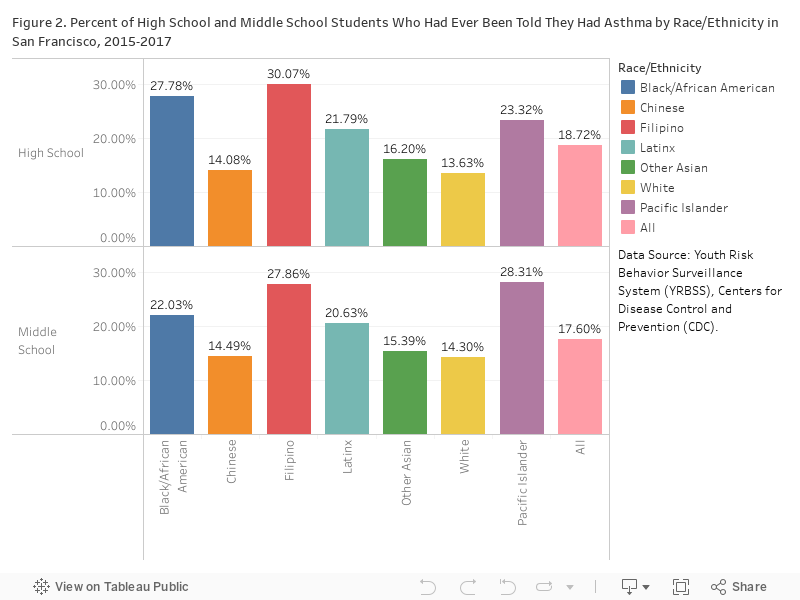
In 2015-2017, 18.72% of high school students and 17.06% of middle school students were told they have asthma. Black/African American and Filipino high school (27.78% and 30.07%) and Pacific Islander and Filipino middle school (28.31% and 27.86%) students were more likely than other ethnicities to have asthma; White and Chinese students were the least likely to report having asthma. (Figure 2)
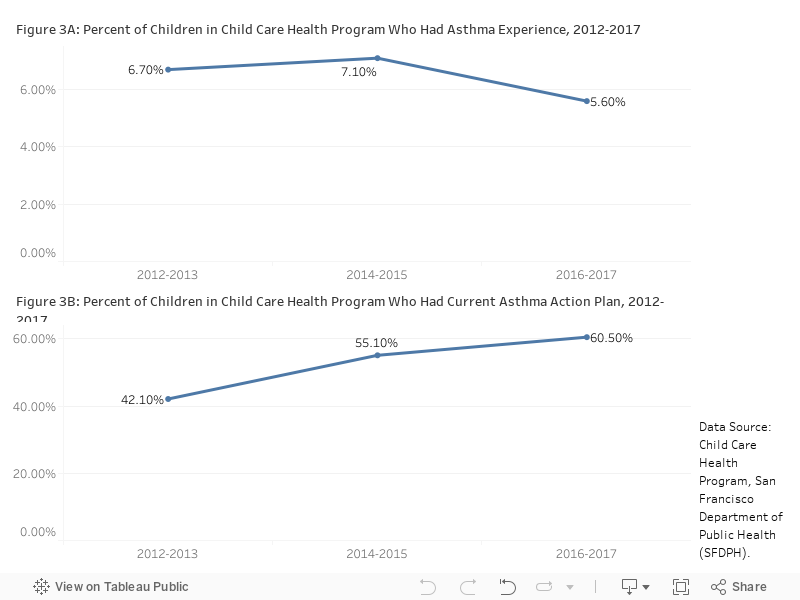
In 2016-2017 school year, 5.6% of low income children in childcare were found to have asthma experience. This represents a decrease from 7.3% in 2013 (Figure 3A). However, up to 40% of children with asthma experience did not have a current asthma action plan on file at their day-care. Having an up to date action plan on file is a hallmark of asthma preparedness, key to avoiding ER visits and hospitalizations (Figure 3B).
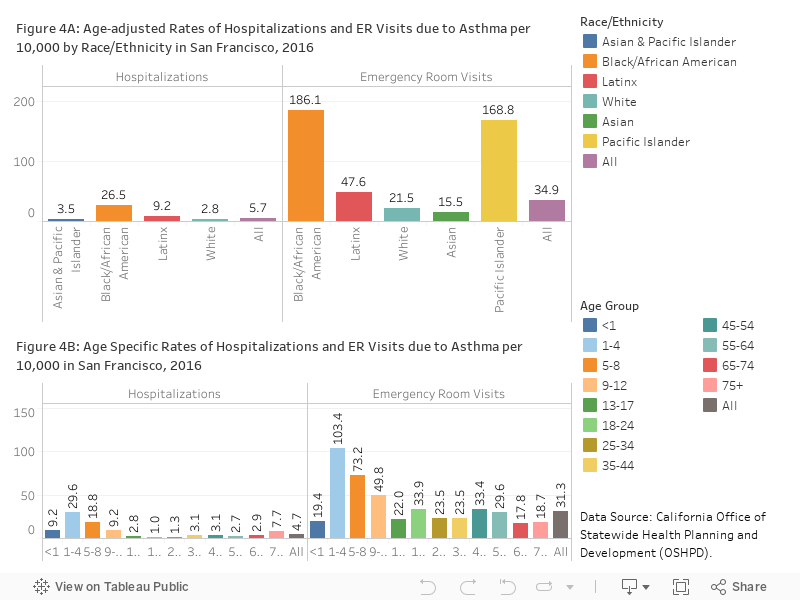
The rates of asthma hospitalizations had been declining significantly since 2012. In 2016, the asthma hospitalization rate was 5.71 per 10,000 residents and the emergency room visit rate was 34.86 per 100 residents. Consistent with higher prevalence, rate of asthma hospitalizations was the highest for Black/African Americans (186.1 per 10,000 residents) and was more than 10 times higher than for Asians; Pacific Islanders had the second highest rate with 168.8 per 10,000 residents (Figure 4A). Asthma hospitalization rates among children age 0-4 are much higher than other age groups (Figure 4B).
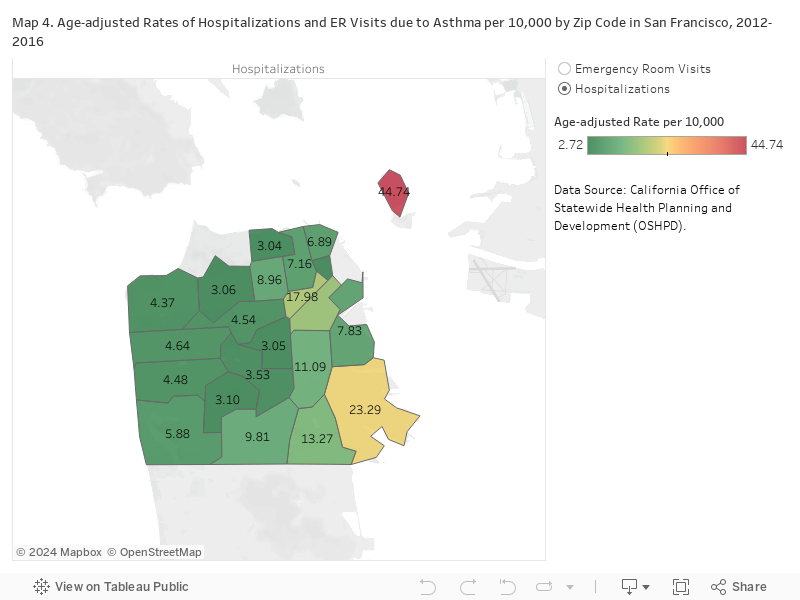
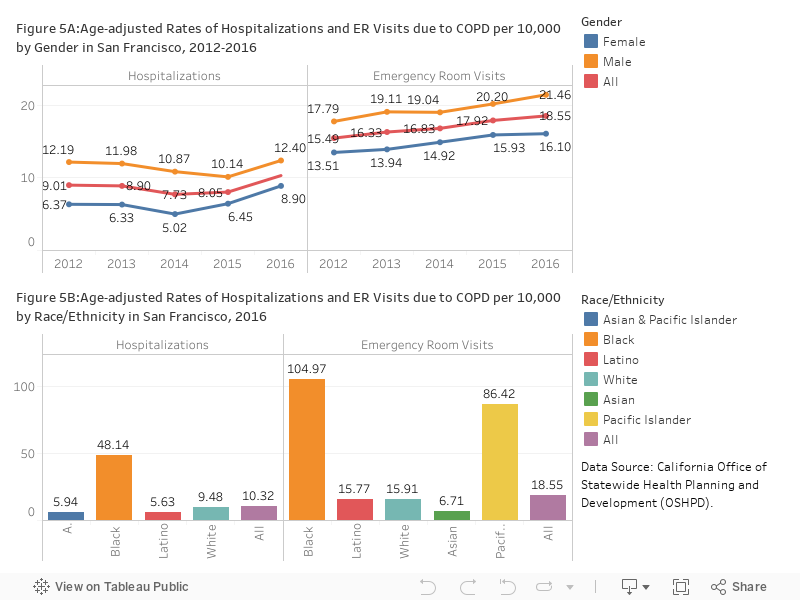
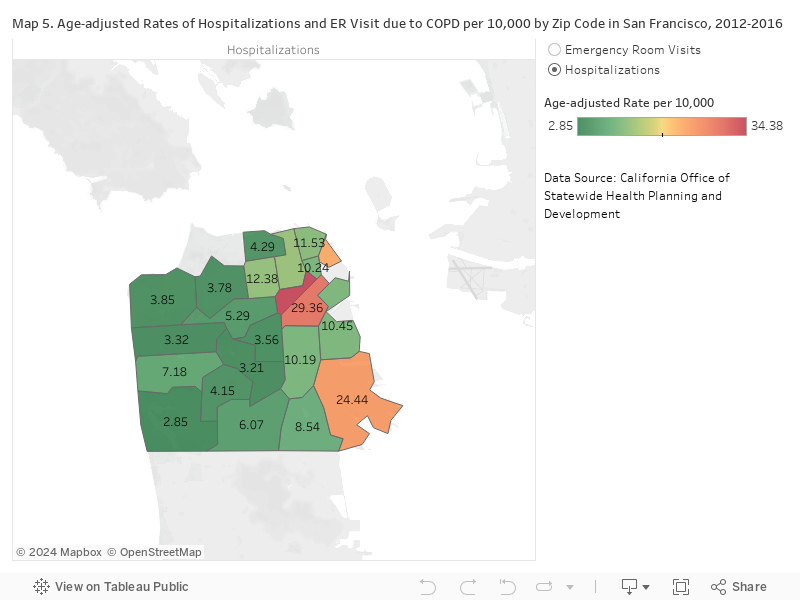
COPD: In 2016 the hospitalization rate due to COPD in San Francisco was 10.3 per 10,000 residents and the emergency room visit rate was 18.55 per 10,000 residents; both rates had been increasing (Figure 5A). Hospitalizations rates due to COPD were historically higher among males than females. As is the case with asthma, Black/African Americans had far higher rate of COPD hospitalizations and emergency room visits than all other races (Figure 5B). COPD hospitalization and emergency room visit rates, similar to asthma, were higher in the Tenderloin, South of Market, and Bayview Hunters Point neighborhoods (Map 4 and 5). These three neighborhoods historically had higher than average minority populations with a lower than average socioeconomic status.
CHIS California Health Interview Survey, UCLA Center for Health Policy Research.
OSHPD Office of Statewide Health Planning and Development.
YRBS Youth Risk Behavioral Surveillance System, Centers of Disease Control and Prevention.
CCHP Child Care Health Program, San Francisco Department of Public Health.
Hospitalizations and Emergency Room Visits:
Hospitalization and ER rates measure the number of admissions or visits, not the number of residents who are hospitalized. Admissions records may include multiple admissions by the same person.
Agency for Healthcare Research and Quality’s Clinical Classification Software versions 2015 (ICD-9) and 2017 (ICD-10) were used to identify visits with COPD and Asthma primary diagnoses. Records meeting the criteria for Asthma or COPD were excluded if cystic fibrosis or other respiratory anomalies were indicated. Codes for cystic fibrosis and other respiratory anomalies were obtained from the Prevention Quality Indicator Technical Specification for Asthma in younger Adults Admission Rate (PQI 15-March 2015, September 2017) and Chronic Obstructive Pulmonary Disease (COPD) or Asthma in Older adults Admission Rate (PQI 05-March 2015, September 2017) published by the Agency for Healthcare Research and Quality.
In October 2015, the diagnosis coding standard for Hospitalizations and Emergency Room visits was changed from ICD-9 to ICD-10. Caution should be used in comparing data (Pre 2015 and post 2015) using the two different standards.
Population estimates for rates:
Standard Population for age adjustment:
Statistical instability: Statistically unstable estimates are not shown in this document. Statistical instability may arise from:
…few respondents to a survey,
…small population sizes, or
…small numbers of affected individuals.
Statistical instability indicates a lack of confidence in an estimates ability to accurately and reliably represent the population. Due to statistical instability, estimates are not available for all age, gender, ethnicity, or other groups.
[1] Centers for Disease Control and Prevention. Chronic obstructive pulmonary disease (copd). https://www.cdc.gov/media/presskits/aahd/diabetes.pdf, 2015. Accessed March1, 2017.
[2] American Lung Association. The link between asthma and copd. http://www.lung.org/local-content/illinois/documents/the-link-between-asthma-nov-2013.pdf, 2013.
[3] Daniel Exley, Alyson Norman, and Michael Hyland. Adverse childhood experience and asthma onset: a systematic review. European respiratory review, 24(136):299–305, 2015.
[4] Lung National Heart and Blood Institute. What is copd? https://www.nhlbi.nih.gov/health/health-topics/topics/copd/, 2013.
[5] Richard Lockey. Defining phenotypes: Expanding our understanding of asthma challenges in treating a heterogeneous disease. http://www.worldallergy.org/UserFiles/file/NHLBI%20Asthma%20Phenotypes-Lockey.pdf, 2010.
[6] Lung National Heart and Blood Institute. What is asthma? https://www.nhlbi.nih.gov/health/health-topics/topics/asthma/, 2014.
[7] Jerry M Melillo, TT Richmond, and G Yohe. Climate change impacts in the united states. Third National Climate Assessment. U.S. Global Change Research Program, 2014.
[8] American Lung Association. Trends in asthma morbidity and mortality. http://www.lung.org/assets/documents/research/asthma-trend-report.pdf, 2012.
[9] American Lung Association. Trends in copd (chronic bronchitis and emphysema) morbidity and mortality. http://www.lung.org/assets/documents/research/copd-trend-report.pdf, 2013.