Variables
- Total Population
- Sex
- Age
- Ethnicity
- Ethnic Diversity
- English Proficiency
- Household Types
- Households with Children
- Single Parents
Demographics are statistical information about a population, such as age, ethnicity, language, and family relationships.
Tracking demographic information is extremely important for planning for the present and future needs of a population. For example, measuring the age of the population informs planning for age-specific resources like schools and senior care facilities. Following trends in race/ethnicity has informed initiatives such as the African American Community Empowerment Initiative (AACEI), which was launched in 2012 to address, prevent and remediate the negative impact of the out-migration of the African American community in San Francisco. Lastly, measuring languages spoken at home helps us appropriately plan for language access programs.
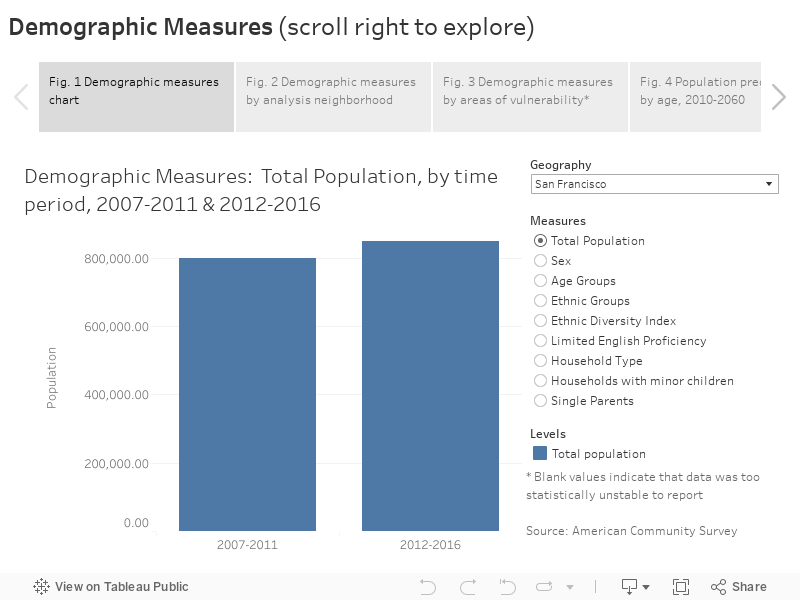
Total Population: Between survey years 2007-2011 and 2012-2016 there was a 6.6% increase in the total population from 797,983 to 850,282 (Figure 1). During the same period, California experienced a 4.5% population increase. The Sunset neighborhood has a largest number of residents while the Tenderloin, Nob Hill, and Chinatown have the highest numbers of residents per square mile (Figure 2). When examined by Areas of Vulnerability (a measure of the density of socioeconomically disadvantaged populations), areas that are not an AOV have a greater number of residents, however the AOV area has greater population density (Figure 3). By 2040, San Francisco’s population is expected to total about 1 million and by 2060, nearly 1.2 million (Figure 4).
Age and sex: The age structure of a population is important in planning for community needs. For example, a younger population may have greater demands for education and child care services, while an older population may have increasing healthcare needs as they age. Between survey years 2007-2011 and 2012-2016 the percent of the population that was between the ages of 25-24 and 65+ increased, while the percent of the population that was between 18-24 decreased (Figure 1). In 2016 the median age in San Francisco is 38 years old, compared to 36.4 years in California. Sixty-three percent of San Franciscans are between the ages of 25 and 64 years (Figure 1). The neighborhoods with the highest percent of youth under 18 include Seacliff, Presidio, and Bayview Hunters Point (Figure 2). Lincoln Park (which contains the VA), Japantown, and Chinatown have the highest percent of persons that are 65+. The part of the city that are considered Areas of Vulnerability have both higher percentage of youth and seniors (Figure 3). Figure 4 presents population projects through 2060 by age and demonstrates that the greatest population growth is expected to come from persons 65+ (134% increase between 2018 and 2060). Similarly, California is expected see a 128% increase in the population 65 and older. At the same time, population projections suggest that the percentage of prime working-age residents in San Francisco will decrease from 49% of the total population in 2018 to 43% in 2030 and 40% in 2060. This has important implications for the San Francisco tax base and the provision of public services as the tax base shrinks (Figure 4).
Overall, there are slightly more males (51 percent) than females (49 percent) in San Francisco (Figure 1). In 2018 males outnumbered females between the ages of 35-64, while females outnumbered males from 65 years and older (Figure 5). Neighborhoods that have a higher male population include Lincoln Park (which houses the VA), Tenderloin, and Castro/Upper Market, which all have over 60% male population (Figure 3). Higher female populations are found in Japantown and McLaren Park, which both also have almost 60% female residents, both of which have higher senior populations, which tend to be more female. Areas that are considered Areas of Vulnerability have a slightly denser male population than areas that are not (Figure 3).
Race and ethnicity: San Francisco is a majority minority city. People of color account for 58% of the city’s total population, while Whites account for 42% (Figure 1). Asians represent the largest minority group (33.5%) followed by Latinos (15.3%) (Figure 1). Communities with a high percentage of Black/African American residents include Bayview/Hunters Point, Western Addition, and Treasure Island, which all 20-27% Black residents (Figure 2). In most neighborhoods Asian residents comprise more that 20% of the population apart from central neighborhoods like, Castro, Mission, Glen Park, and Noe Valley (Figure 2). Dense Latino/a communities are found in the neighborhoods that border Mission Street. Neighborhoods that have predominantly White residents include central and northern neighborhoods.
Between 2018 and 2060, multi-ethnic residents are expected to see a 25% increase (4% to 5%) and White residents are expected to increase by 9.5% (42% to 46%) (Figure 6). Conversely, African American resident are expected to see a 40% decline from 5% to 3%, while the percent of Asian and Latino/a is also expected to decline. It should be noted that this trend among Whites is the opposite of that expected statewide, where there is a projected decrease in the percent of the population that is White, and significant growth in the Latino/a population.
Between ACS survey years 2007-2011 and 2012-2016, there was an increase in the ethnic diversity score for San Francisco, which is the probability that any two people chosen at random from a given study area (e.g., neighborhood) are of different races or ethnicities (from 71.75 to 74.11) (Figure 1). Figure 2 demonstrates that the neighborhoods with the greatest diversity are along the eastern and southern sides of the city. When examined by Areas of Vulnerability, parts of the city with an AOV designation have a higher diversity score than the city as a whole, while non-AOVs have a score lower than the city’s (Figure 3).
Language: Roughly 24% of San Franciscans, 5 years and older, have limited ability to speak English (Figure 1). In 2016, Among residents that have limited English proficiency, Chinese (Mandarin, Cantonese, and others) and Spanish are the most prevalent non-English languages, with 56.5% and 20.9% of the limited English speaking population, respectively, speaking these languages (ACS data not shown). Tagalog (5.6%), Vietnamese (4.1%), and Russian (3.5%) are the next most widely spoken languages among limited English speakers (ACS data not shown).
The neighborhood with the highest percentage of residents with limited English proficiency is Chinatown, where 71% of the population does not speak English very well (Figure 2). Other neighborhoods with a high percentage of people who speak a language other than English at home and speak English less than very well include Visitacion Valley, Excelsior, Portola, the Outer Mission, and Oceanview/ Merced/Ingleside which all have greater than 35% of residents with limited English proficiency. Having limited English proficiency is more prevalent among seniors. In 2016 40.8% of adults 65+, 17.8% of adults 18-64, and 8.7% of youth 5-17 had limited English speaking abilities (ACS data not shown). This highlights the need for translation services, particularly for older populations, so that they can access services.
Households structure: Between survey years 2007-2011 and 2012-2016 there were statistically significant changes in the distribution of household types in San Francisco. Roommate and family households increased, while the percent of people living alone decreased (Figure 1). At the same time there were no significant changes in the percent of households that contained children under the age of 18 (Figure 1). Similarly, the percent of children with unmarried parents (Figure 1). Family households are most prevalent in the southern neighborhoods in San Francisco, with Portola, Seacliff, and Visitacion Valley all being over 75% family households (Figure 2). Roommate households are most common in Treasure Island, Castro/Upper Market, and Presidio, which comprise at least 30% of the household mix. Single person households are the most common in the northeastern part of San Francisco, with the Tenderloin, Japantown, Nob Hill, Marina, Pacific Heights, and SOMA all having over 55% residents living alone. When examined by Areas of Vulnerability, AOV’s have a higher percent of households that are in families or single persons, while non-AOVs have a higher percent of non-related roommate households (Figure 3).
Visitacion Valley, Bayview/Hunters Point, Outer Mission, and Excelsior all have the highest proportion of households containing youth (all over 35%) (Figure 2). Hayes Valley has the highest percent of children living with unmarried parents. AOVs have a higher percent of households that contain minor children and a higher percent of children with unmarried parents than non-AOVs (Figure 3).
ACS American Communities Survey. https://www.census.gov/programs-surveys/acs/
CADOF California Department of Finance, Demographic Projections. http://www.dof.ca.gov/Forecasting/Demographics/Projections/
Statistical instability: Statistically unstable estimates are not shown in this document. Statistical instability may arise from:
…few respondents to a survey,
…small population sizes, or
…small numbers of affected individuals.
Statistical instability indicates a lack of confidence in an estimates ability to accurately and reliably represent the population. Due to statistical instability, estimates are not available for all age, gender, ethnicity, or other groups.
Areas of Vulnerability: Areas of Vulnerability (AOV) were created as a way to examine geographic data in relation to populations of concentrated socioeconomic disadvantage. The criteria to be designated as an AOV were:
1) Top 1/3rd of tracts for < 200% poverty or < 400% poverty & top 1/3rd for persons of color OR
2) Top 1/3rd of tracts for < 200% poverty or < 400% poverty & top 1/3rd for youth or seniors (65+) OR
3) Top 1/3rd of tracts for < 200% poverty or < 400% poverty & top 1/3rd for 2 other categories (unemployment, completing high school or less, limited English proficiency persons, linguistically isolated households, or disability)
Tracts that had unstable data for an indicator were automatically given zero credit for that indicator.
