Variables
- MUNI DISCOUNT PROGRAM PARTICIPATION
- RATIO OF BIKE LANES AND PATHS TO ROAD MILES
- VEHICLE ACCESS
- COMMUTE MODE
- TRAFFIC DENSITY (AVERAGE DAILY MILES OF VEHICLE TRAVEL PER SQUARE KM)
- SEVERE AND FATAL TRANSPORTATION INJURIES PER 100 ROAD MILES
Transportation systems include the infrastructure and operation of facilities that help move people who are walking, biking, taking public transit, and traveling by motor vehicles.
Transportation systems affect our health in multiple ways, such as: access to goods and services; neighborhood livability (e.g. physical activity, social engagement or disorder); injuries and fatalities occurring on the transportation system; and environmental quality associated with transportation system operations, particularly with regard to noise, clean air, and clean water.
Transportation system design impacts whether people are able to walk, bike, take public transit, play, access basic needs, and whether they are able to do so safely. Safe transportation systems that support walking, biking and public transportation can contribute to good health by increasing physical activity and social interactions, and decreasing obesity, depression, cancer, heart disease, diabetes, and other chronic diseases as well as traffic injury and death. Transportation system policies also impact people’s exposure to transportation-related noise and air pollution from motor vehicles, which have an effect on people’s ability to sleep, concentrate, communicate, and breathe clean air. These forms of pollution are associated with health-related outcomes including stress, hypertension, high blood pressure, heart disease, learning delays, sleep disturbances, hearing impairment, lung function, asthma, bronchitis, medical visits, and cancer. [1] Large trucks pose increased safety hazards, particularly to people walking and biking, due to their size and with diesel emissions particularly harmful to human health. Vehicle speeds also have significant impacts on safety, with an increase of just one mile per hour impacting whether someone walking is able to survive a crash. Relatedly, transportation system policy and design also impact the amount of greenhouse gas emissions emitted from vehicles – with climate change having a range of significant health impacts including heat-related illness and death, exacerbated air pollution and related illnesses, and potential increases in infectious diseases such as West Nile Virus or Lyme Disease. [2] Access to reliable public transit is also critical to the health of many seniors, people with disabilities, low income residents, and other vulnerable populations who rely on public transit to reach grocery stores, health care, and other critical goods and services. Significantly, transportation system design – including local safety improvements as well as public transit service – determines who experiences positive or negative impacts, and whether those impacts are disproportionately distributed among communities based on factors such as age, race, ethnicity, income, and immigrant status. [3]
Emerging mobility issues such as autonomous vehicles, electric scooter and bicycles, ride hail services and shuttles in San Francisco have the potential to benefit health and also potential negative impacts, depending on whether and how their implementation supports safe transportation, reduces vehicle trips or address inequities in transportation access and safety.
The impact of the transportation system on the health of San Franciscans is assessed through a number of indicators that describe supports for non-auto dependent transportation, transportation behaviors, and transportation hazards.
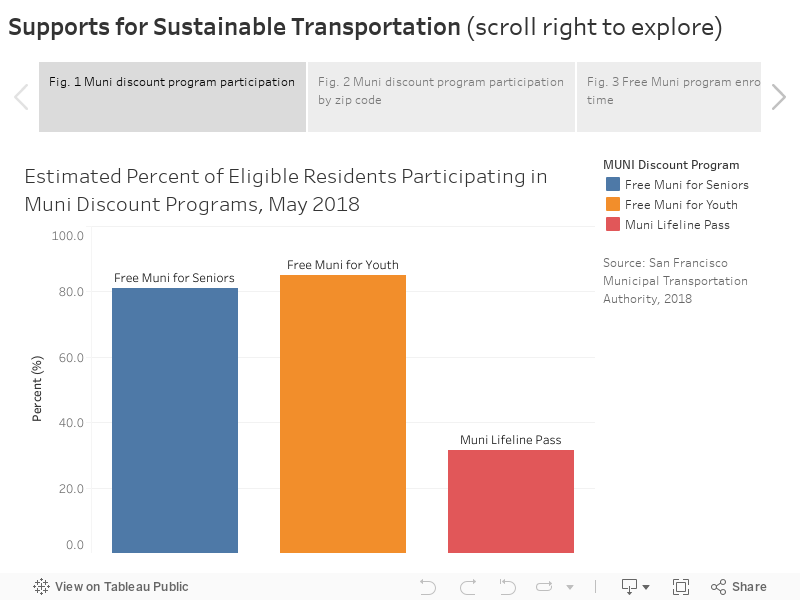
Transit subsidy programs: Transit subsidy programs allow low income residents to utilize San Francisco’s public transportation system to meet their needs, without diverting much needed funds from housing, food, and medical costs. Free Muni for Youth provides low and moderate-income youth ages 5-18 free access to Muni services when using a Clipper card. The Free Muni for Seniors program does the same for adults 65+, as does Free Muni for People with Disabilities for persons who have a disability. These programs were launched between 2013-2015. The Lifeline program is a 50% discount off the standard adult monthly pass price and is available to adults with household incomes at or below 200% of the Federal Poverty Level. To estimate the reach of these programs we divided the number of enrollees by the estimated number or residents that may be eligible (see the methods section below for more information). In 2018, and estimate 80% of eligible youth, 85% of eligible seniors, and 31% of eligible adults (Lifeline) participated (Figure 1). Seniors have high participation in zip codes on the western, southeastern, and northeastern sides of the city (Figure 2). The youth program has the highest participation in the zip codes that cover the Tenderloin, Western Addition, Nob Hill, and South of Market neighborhoods – which are all estimated to have over 100% participation. Rates over 100% in these neighborhoods are likely due to inaccurate estimates of the eligible population from the American Community Survey. Most other zip codes have participation rates for youth at or above 80%. Lifeline pass participation is the highest in 94134 which covers the Visitacion Valley neighborhood (and includes the large Sunnydale public housing site). The number of enrollees in free Muni programs has been steadily climbing between 2016-2018, indicating the programs’ ongoing popularity (Figure 3).
Bicycle network: Well-maintained, highly-connected, and safe bicycle routes in San Francisco can support public health by facilitating more cycling for transportation and recreation, a potentially important strategy for increasing physical activity and reducing the negative impacts of auto travel. Overall in San Francisco, there are 0.2 miles of bike lanes and paths per road mile (Figure 4). San Francisco’s park lands, including Golden Gate Park, Lake Merced (Lakeshore neighborhood), the Presidio, and Lincoln Park have the highest ratios. Mission Bay, Mission, Japantown, and Financial District/South Beach all have over 0.3 miles of bike lanes/paths per road mile. Pacific Heights has no bike lanes or paths, and Chinatown and Haight Ashbury have only 0.01 miles of lanes/paths per street mile. Areas of San Francisco that are designated as Areas of Vulnerability have a slightly lower ratio of bike lanes/paths to street miles (0.18) compared to parts of the city that do not have this designation (0.20) (Figure 5).
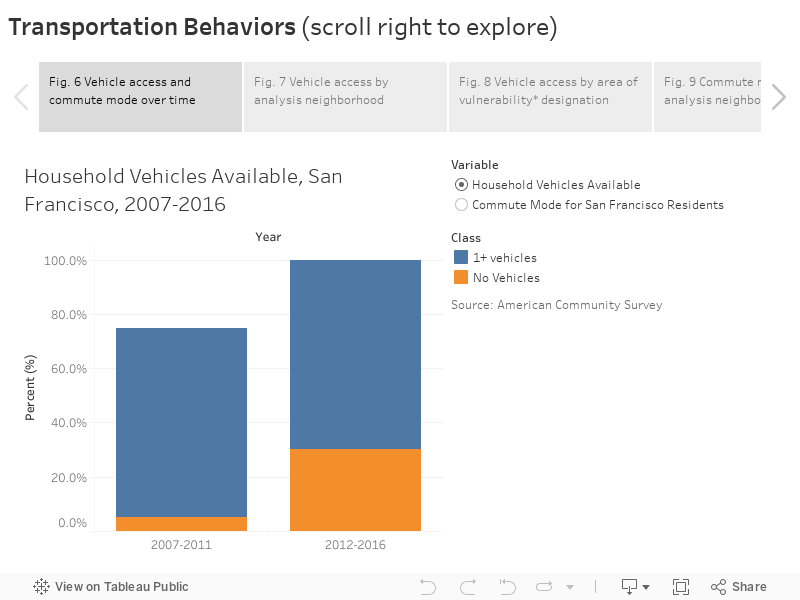
Vehicle access: Access to a private automobile can have both positive and negative impacts on public health. Individuals that have access to a personal vehicle may be less likely to walk, bike, or use transit when possible. However, for individuals that live in parts of the city that are harder to navigate by walking, biking, or taking transit, or who have mobility constraints, lack of access to a car may impact their ability to get to medical care, work, school, or to buy healthy food. In San Francisco, about 30% of households do not have access to a personal vehicle, and this has remained consistent between 2007-2016 (Figure 6). The neighborhoods with the lowest car access include Tenderloin, Chinatown, MacLaren Park, Nob Hill, Japantown, and South of Market, which all have less than 43% of households with vehicle access (Figure 7). The low rate of car access in MacLaren Park compared to the surrounding neighborhoods is likely because much of the population that falls within its borders lives in the Sunnydale Public Housing site, where residents may not have the income necessary to have a car. Figure 8 shows that parts of the city that are designated as Areas of Vulnerability have lower access to vehicles compared to elsewhere in the city.
Walking, biking and public transit: Modes of transportation that replace trips made by private auto can have a positive impact on the health of a community, by increasing physical activity through active transportation, and by removing polluting vehicles from local roadways. Approximately 42% percent of San Francisco residents commute to work by car – 35% driving alone and 7% carpooling (Figure 6). Between 2007-2011 and 2012-2016 there was a significant decrease in the percent of people diving alone (38% to 35%). There were also significant increases in the percent of workers commuting by bike (3% to 4%) and those that use other modes (including Lyft/Uber, taxi, and motorcycle – 2% to 3%). Walking and transit usage also saw some increases. The neighborhoods with the highest proportion of automobile trips are as expected in the southern and western portions of the city (Figure 9). Neighborhoods with a high proportion of residents commuting by transit are predominantly located along BART and Muni rail lines. Commuting by foot is most common downtown, while rates of biking are the highest in the Mission neighborhood where 11% of residents bike to work. Other types of transportation, including Lyft/Uber, taxis, Chariot, and motorcycles are most common in the northern central part of San Francisco, including the neighborhoods of Pacific Heights, Russian Hill, Marina, and Haight Ashbury. Working from home is most common in more affluent neighborhoods, including Presidio, Seacliff, and Noe Valley. A slightly higher proportion of residents in areas that are not designated as Areas of Vulnerability commute by car than Areas of Vulnerability (Figure 10). Transit and walking are more common in AOVs while biking is more common in non-AOVs. AOVs have half the rate of working from home compared to non-AOVs.
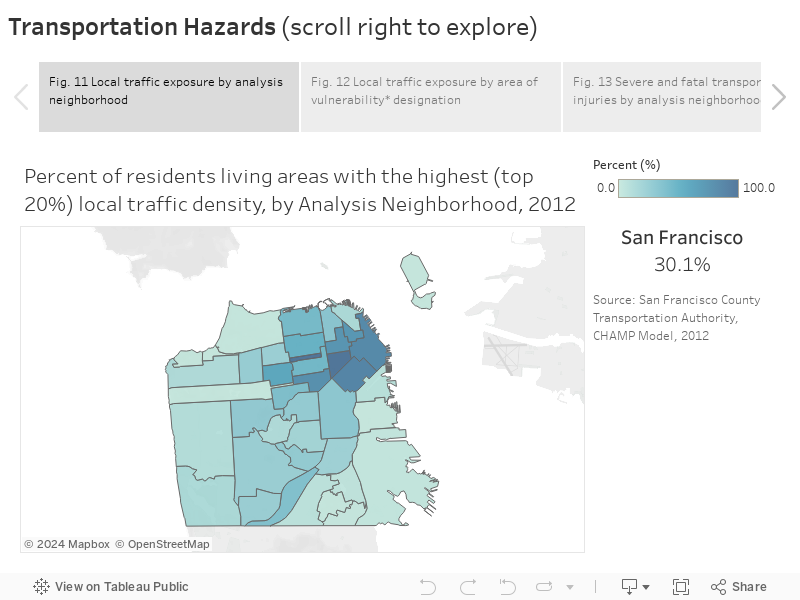
Local traffic density: Traffic density is a general proxy for adverse environmental exposures and health hazards of traffic. For this indicator we are measuring traffic on local streets, and freeways have been excluded. The air quality impacts of highway proximity are best captured in the air quality indicator on the Climate and Natural Environmentpage. Local traffic adverse environmental impacts include risk of transportation injury, noise, and air pollution. For this analysis we used traffic volume data from the San Francisco County Transportation Authority’s 2012 CHAMP model, which was released in 2015. In San Francisco, about 30% of residents live in parts of the city with the top 20% of traffic density (Figure 11). The neighborhoods that are most impacted include Tenderloin, Japantown, South of Market, Financial District, Hayes Valley, Chinatown, and Nob Hill, which all have over 70% of residents living in the most traffic dense parts of the city. Traffic density exposure does not greatly differ by Areas of Vulnerability (Figure 12).
Traffic injuries: Historically, every year in San Francisco about 30 people lose their lives and over 200 people are seriously injured while travelling on city streets. These tragedies are the impetus for San Francisco’s Vision Zero Initiative, which seeks to eliminate traffic deaths of city streets. To better track injury, Vision Zero developed a comprehensive Transportation-related Injury Surveillance System (TISS) linking hospital, police, emergency response and other data for more accurate, coordinated and timely monitoring of transportation-related injuries and deaths. Using data from TISS from 2013-2015, there were about 99 severe or fatal traffic injuries per 100 road miles (Figure 13). The Tenderloin neighborhood is by far the most impacted by traffic injury and the rate of severe and fatal traffic injuries is nearly six times as high as the city overall (598). Other highly impacted neighborhoods include all of the neighborhoods that border the Tenderloin, including: South of Market, Nob Hill, Japantown, Western Addition, Mission, and Hayes Valley. The rate of severe and fatal traffic injuries in parts of the city designated as Areas of Vulnerability is nearly twice as high as elsewhere in the city (Figure 14). The geographic densities of traffic injury are consistent with Vision Zero’s High Injury Network which demonstrates that 75% of the severe and fatal traffic injuries in San Francisco, occur on just 13% of city streets.
Vision Zero SF is San Francisco’s policy and commitment to eliminate traffic deaths on San Francisco streets through coordinated actions by multiple city agencies to create safe streets, safe people and safe vehicles. SFDPH has co-chaired Vision Zero with the SF Municipal Transportation Agency since its adoption in 2014. There were 20 traffic deaths in San Francisco in 2017, the lowest in over 100 years. The San Francisco Municipal Transportation Agency completed 34 miles of engineering improvements on the Vision Zero High Injury Network in 2017, where 13% of streets account for 75% of severe and fatal injuries in the city.
SFMTA San Francisco Metropolitan Transportation Agency. https://www.sfmta.com/
ACS American Community Survey. https://www.census.gov/programs-surveys/acs/
SFCTA San Francisco County Transportation Authority. https://www.sfcta.org/modeling-and-travel-forecasting
SFDPH San Francisco Department of Public Health. https://www.sfdph.org/dph/EH/PHES/PHES/TransportationandHealth.asp
Muni Subsidy Programs: The number of participants was collected by SFMTA for the Free Muni for Youth Program, Muni Lifeline Program, Free Muni for Seniors Program, and Free Muni for Persons with Disabilities Program at the zip code level.
To estimate the number of eligible residents, numbers were pulled from the American Community Survey. The following criteria were used to calculate the number of eligible residents:
The number of program participants was then divided by the estimated eligible population.
Bike lanes and paths: The number of miles of bike lanes and paths were summarized by geography using the SFMTA’s bike network files from 2011, 2013, 2015, and 2017. That mileage was then divided by the number of street miles from the City’s street centerlines file.
Traffic density: The 24-hour daily vehicle volume per street segment for 2012 was provided by the San Francisco County Transportation Authority from their travel forecasting model, SF CHAMP. Estimated Traffic Density was calculated as a smooth surface over San Francisco using the ArcGIS Kernel Density tool and a 100-meter grid size (with the default search radius of 450 meters). This method calculates the density of traffic on roadways in the neighborhood of each 100-meter cell. A smoothly curved surface is fitted over each street, with its value greatest on the street and diminishing as distance increases from the street (line) reaching zero at the search radius. The surface is defined so the volume under the surface equals the product of street length and the 24-hour vehicle count metric described above. The density at each 100-meter grid cell is calculated by adding the values of all the surfaces where they overlay the grid cell center.
After this grid, called a raster, was created, the average traffic density was calculated for each residential parcel in San Francisco by averaging all of the grid cells that fell inside of the parcel. The average traffic density exposure for each parcel was divided into quintiles and the parcels with the top 20% of exposure were flagged. The percent of the neighborhood population falling in that top 20% was calculating by dividing the number of persons living in the flagged parcels by the total population of the neighborhood.
The number of people living in each parcel was estimated using dasymetric mapping. Dasymetric mapping involves assigning each residential lot to a Census tract and calculating the total number of residential square feet within the tract. Each parcel’s residential square feet is then divided by the total residential square feet in its assigned tract, to approximate the percentage of residential space that each parcel makes up. This percentage is then multiplied by the number of people within the assigned tract, such that we can estimate the number of people living in each parcel. Once we have estimates for the number of people living in each parcel, we assign each lot to the neighborhood that it falls within and calculate the number of people living in each neighborhood.
Statistical instability: Statistically unstable estimates are not shown in this document. Statistical instability may arise from:
…few respondents to a survey,
…small population sizes, or
…small numbers of affected individuals.
Statistical instability indicates a lack of confidence in an estimates ability to accurately and reliably represent the population. Due to statistical instability, estimates are not available for all age, gender, ethnicity, or other groups.
Areas of Vulnerability: Areas of Vulnerability (AOV) were created as a way to examine geographic data in relation to populations of concentrated socioeconomic disadvantage. The criteria to be designated as an AOV were:
1) Top 1/3rd of tracts for < 200% poverty or < 400% poverty & top 1/3rd for persons of color OR
2) Top 1/3rd of tracts for < 200% poverty or < 400% poverty & top 1/3rd for youth or seniors (65+) OR
3) Top 1/3rd of tracts for < 200% poverty or < 400% poverty & top 1/3rd for 2 other categories (unemployment, completing high school or less, limited English proficiency persons, linguistically isolated households, or disability)
Tracts that had unstable data for an indicator were automatically given zero credit for that indicator.
[1] Litman T. Transportation and Public Health. Annual Review of Public Health. 2013. Vol. 34:217-233.
https://doi.org/10.1146/annurev-publhealth-031912-114502
[2] SFDPH. Assessing the Co-Benefits of San Francisco’s Climate Action Plan. 2017. Available at: https://extxfer.sfdph.org/gis/ClimateHealth/Reports%20and%20Research/CAP%20130826.pdf
[3] Dannenberg A, Sener I.Why Public Health and Transportation: Setting the Stage. TR News. Number 299. September-October 2015. Pg. 4-10. http://onlinepubs.trb.org/onlinepubs/trnews/trnews299feature.pd
