Variables
- HOUSING PRODUCTION BY AFFORDABILITY
- WORKERS LIVING IN SAN FRANCISCO
- HOUSING TENURE
- EXCESSIVE RENT BURDEN
- OVERCROWDING
- EVICTION NOTICES
- UNSHELTERED HOMELESS
- PUBLIC HEALTH HOUSING VIOLATIONS
These housing variables cover the availability, affordability, stability, and safety of shelter.
Housing is a key social determinant of health. The availability, affordability, quality, stability, and safety of housing in a community has a major impact on the health and wellbeing of that community.
Availability and Affordability: Insufficient supply and high demand, coupled with widening income inequality, have created a housing crisis in the Bay Area and many other cities across the country. When housing costs are high relative to household income, households are less able to afford necessary expenses, such as food, utilities, transportation, child care, and healthcare. Research demonstrates that low-income households that can afford their housing are able to spend nearly five times as much on healthcare and a third more on food than those severely burdened with housing costs. [1]
Residential Stability: In high-pressure housing markets with an insufficient supply of permanently affordable housing, residents may be forced into crowded living conditions, experience evictions, or fall into homelessness, if not displaced from the city completely.
Housing Safety: When housing costs are high, people are likely to accept these unsafe housing conditions. Environmental health inspectors have found that many tenants are reluctant to complain to landlords about physically unsafe conditions because the tenants fear they will be evicted and will be unable to find other affordable housing in San Francisco. The health and safety of a population are also significantly affected by the quality and maintenance of the housing infrastructure.[18] Older, poorly maintained buildings are often substandard, and not fully safe for habitation. Inadequate heating or ventilation, along with uncontrolled moisture sources, can promote the growth of mold and provide nourishment to pests such as roaches and dust mites, all contributors to asthma and respiratory allergies. Older housing stock also may have lead-based paint, a source of lead poisoning that’s particularly dangerous for young children. Other infrastructure problems include exposed electrical wiring, unsafe heaters, and unprotected windows.
Availability and Affordability
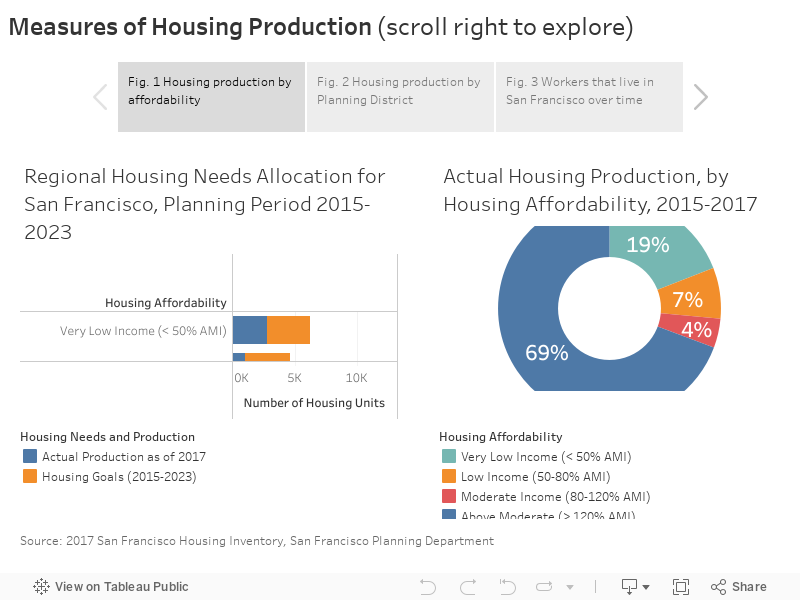
Housing Production: Every eight years, the Association of Bay Area Governments (ABAG) produces a Regional Housing Needs Assessment, which identifies the number of housing units each jurisdiction must accommodate in it Housing Element. [19] The current planning period is 2015-2023. Figure 1 illustrates the prescribed number of housing units to be built during that period in orange and the number of completed units in blue, by housing affordability calculated as a percent of the Area Median Income (AMI). Like past trends, San Francisco generally meets or exceeds goals for market rate housing (> 120% AMI), but generally has the lowest completion rate for low and moderate-income housing (50-120% AMI). Between 2015-2017, 69% of all housing built was market rate, while only 4% was for moderate income residents (Figure 1). In terms of where new housing is being built, the eastern side of the city, particularly South of Market, is experiencing the greatest increase in housing units (Figure 2). The South of Market Planning District alone accounted for over half of all housing units built between 2015-2017. The other areas that saw significant development include the districts that includes Bayview and the Tenderloin/Financial District. From a health perspective it is important to ensure that considerations are made to address issues that may include transportation safety and sufficiency, air quality, and access to public and retail services.
The affordability and sufficiency of the housing supply has a direct impact on whether people who work in San Francisco are able to also live here. Figure 3 demonstrates that between 1990 and 2014/15 there was a significant decrease in the percent of low income San Francisco workers (<80% AMI) that lived in San Francisco, a moderate decrease in the percent of middle income workers (80-140% AMI) that lived in the City, and a significant increase in the percent of higher wage workers (> 140% AMI) that lived and worked in the City. This shift may have come about for a variety of reasons, including higher growth in low-wage, service sector jobs, but unfortunately means that more of San Francisco’s workforce is having to shoulder the burden of higher transportation costs to reach their place of employment
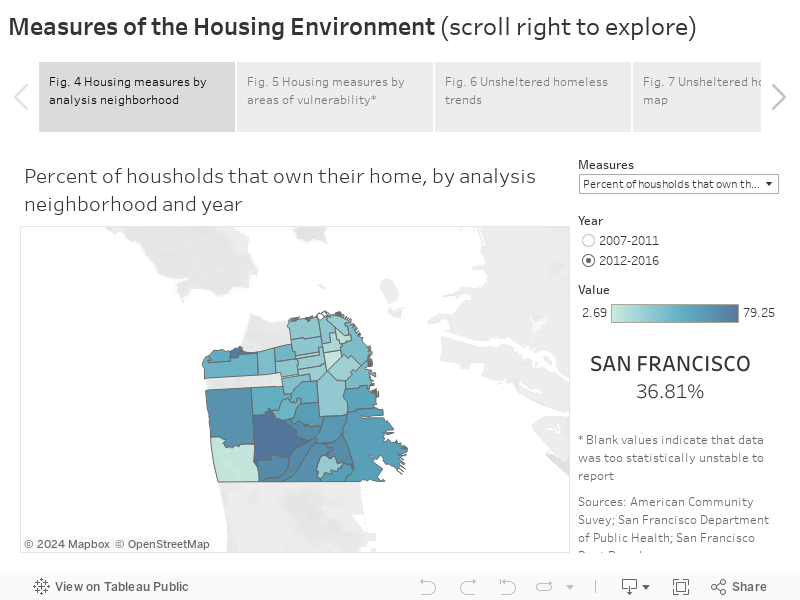
Home Ownership: Whether a household rents or owns their home can have important health and social impacts. Owning one’s home is associated with reduced physical health problems and a greater sense of control, which leads to improved mental health. [20] Homeowners are also more likely to vote and home ownership is associated with greater willingness to fix community problems. Perhaps more importantly, owning one’s home decreases vulnerability to eviction and displacement. In San Francisco, about 37% of households own their home (Figure 4). Home ownership rates are highest in more affluent neighborhoods, like Seacliff and West of Twin Peaks, as well as most of the southern neighborhoods and Sunset/Parkside, which all have over 50% home ownership. Areas of Vulnerability have lower home ownership rates than other areas of the city (Figure 4). There are no differences in home ownership by gender (Figure 8). Asian residents are the most likely to own their home, while Black and Latino/a are the least likely (Figure 9). Households with incomes 200% of the federal poverty level (FPL) or more have a home ownership rate twice that of households with incomes below 200% FPL (Figure 10).
Rent Burden: For San Francisco households that rent, about 20% pay 50% or more of their income to rent (Figure 4). The highest rate of excessive rent burden is in the Lakeshore neighborhood, likely because of the density of student housing from SF State. Other neighborhoods with high levels of excessive rent burden include Chinatown, Tenderloin, OMI, Outer Mission, Excelsior, Visitaction Valley, and Bayview, which all have around 30% of households paying 50% or more of their income. In Areas of Vulnerability about 26% of households are severely rent burdened compared to 17% in the rest of the city (Figure 4). There are no differences by gender (Figure 8). A higher percent of Asian and Latino households pay more than 50% of their income to rent compared to White households (Figure 9). Over 50% of household living below 200% of the federal poverty level (FPL) pay 50% or more of their income to rent (Figure 10). This statistic is particularly troubling, because these households already have limited disposable income for necessary expenses like food and medical care.
Housing Stability
Overcrowding: Overcrowding, as defined by the United States Department of Housing and Urban Development (HUD), is more than 1.01 people per habitable room. Severe overcrowding is defined as more than 1.51 people per habitable room. Due to data limitations, crowding statistics are presented as the number of units that are not overcrowded. In 2012-2016, 94% of San Francisco’s households were not overcrowded (Figure 4). The neighborhoods that have the fewest households living in uncrowded conditions are Chinatown, Tenderloin, Visitacion Valley, Portola, Excelsior, and Outer Mission. The situation in Chinatown is particularly bad, with only 71% of households living in uncrowded conditions (Figure 4). In Areas of Vulnerability, only 88% of households are not overcrowded, compared to 97% in the rest of the city (Figure 5). There are no significant differences in overcrowding by gender (Figure 8). Asian and Latino/a households are significantly less likely to be uncrowded compared to White households (Figure 9). Only 89% of household living below 200% of the federal poverty level (FPL) live in uncrowded conditions, compared to 96% of those living at or above 200% FPL (Figure 10).
Eviction Notices: In San Francisco, Rent Control applies all units built before June 13, 1979, with the exception of single family homes and condo units.C This policy establishes acceptable rent increase limits and states that tenants can only be evicted for “just causes.” Under the Rent Ordinance, landlords must file a notice with the Rent Board if they intend to evict a tenant (unless it is due to a failure to pay rent). A notice of eviction does not necessarily indicate that the tenant was evicted. In 2017, there were 3.7 eviction notices served per 1,000 rent-controlled (rental properties built before 1980) properties (Figure 4). This represents a notable decline from rates exceeding 10 notices per 1,000 rent-controlled units in previous years and is likely due to the passage of Eviction Protection 2.0 which strengthened eviction protections and went into effect in November 2015. [21] In 2017, the neighborhood with the highest eviction notice rate was Outer Mission, where 30 eviction notices were served at a rate of nearly 16 per 1,000 rent-controlled housing units. While Outer Mission had the highest rate, Sunset/Parkside and the Mission had the highest count of eviction notices in 2017 – 68 and 67 respectively. In 2015, the neighborhoods with the most eviction notices were Mission (175), Tenderloin (173), Sunset/Parkside (158), and Outer Richmond (133). The neighborhoods with the most notable decreased in evictions between 2015 and 2017 include Marina, Tenderloin, Financial District/South Beach, and Castro/Upper Market. In all years the rate of eviction notices served is higher in parts of the city designated as Areas of Vulnerability (AOV) Compared to the rest of the city (Figure 5). Decreases in eviction notice rates between 2015 and 2017 were similar for AOVs and non-AOVs.
Homelessness: From 2013 to 2017 the number of unsheltered homeless people in San Francisco remained relatively constant (Figure 6). Between 2013 and 2017, about 58 percent of the homeless population was unsheltered. [22] Of those that were sheltered in 2017, 20% were in residential programs, jails, and hospitals. [22]
The majority (92%) of homeless persons were individuals without children; 8% were in families with children. [22] Over time the number of homeless persons who are living as a family with children has remained consistent. In 2017, 6% of those counted were under the age of 18, and 18% were between 18 and 24 years. [22]
Homelessness disproportionately affects people of color and is concentrated in the eastern neighborhoods. Despite making up only 6 percent of the general population, 35% of the homeless population is Black/African American. Latinos also make up a larger portion of the homeless population than the general population (22% versus 15% respectively). [22] Only 4% of the homeless population is Asian. Supervisorial districts ten and six have the largest unsheltered homeless populations (Figure 7). While the primary cause of homelessness is not always clear, the top three causes include job loss (22%), substance use (15%), and eviction (12%). [22] Top obstacles to obtaining permanent housing included not being able to afford rent (56%), lack of income (33%), and lack of housing availability (25%). [22]
ACS American Communities Survey. https://www.census.gov/programs-surveys/acs/
Planning San Francisco Planning Department. http://sf-planning.org/citywide-policy-reports-and-publications
HSH San Francisco Department of Homelessness and Supportive Housing. http://hsh.sfgov.org/research-reports/san-francisco-homeless-point-in-time-count-reports/
SFDPH San Francisco Department of Public Health. https://www.sfdph.org/dph/EH/Housing/healthy.asp
Rent Board San Francisco Rent Board. https://sfrb.org/annual-eviction-report
Statistical instability: Statistically unstable estimates are not shown in this document. Statistical instability may arise from:
…few respondents to a survey,
…small population sizes, or
…small numbers of affected individuals.
Statistical instability indicates a lack of confidence in an estimates ability to accurately and reliably represent the population. Due to statistical instability, estimates are not available for all age, gender, ethnicity, or other groups.
Areas of Vulnerability: Areas of Vulnerability (AOV) were created as a way to examine geographic data in relation to populations of concentrated socioeconomic disadvantage. The criteria to be designated as an AOV were:
1) Top 1/3rd of tracts for < 200% poverty or < 400% poverty & top 1/3rd for persons of color OR
2) Top 1/3rd of tracts for < 200% poverty or < 400% poverty & top 1/3rd for youth or seniors (65+) OR
3) Top 1/3rd of tracts for < 200% poverty or < 400% poverty & top 1/3rd for 2 other categories (unemployment, completing high school or less, limited English proficiency persons, linguistically isolated households, or disability)
Tracts that had unstable data for an indicator were automatically given zero credit for that indicator.
[1] Harvard Joint Center for Housing Studies, “State of the Nation’s Housing,” Harvard University, 2018.
[2] US Department of Housing and Urban Development, “American Housing Survey Reveals Rise in Doubled-Up Households During Recession.” [Online]. Available: https://www.huduser.gov/portal/pdredge/pdr_edge_research_012714.html. [Accessed: 04-Sep-2018].
[3] W. Cox, “Overcrowded California,” New Geography, 17-Nov-2016. [Online]. Available: http://www.newgeography.com/content/005452-overcrowded-california. [Accessed: 05-Sep-2018].
[4] J. Krieger and D. L. Higgins, “Housing and health: time again for public health action.,” American journal of public health, vol. 92, no. 5, pp. 758–768, May 2002.
[5] R. Baggott, T. J. Brown, R. Hunt, and K. L. Jones, “The impact of overcrowding on health and education: a review of the evidence and literature,” 2004.
[6] D. P. Ross and P. Roberts, Income and child well-being: A new perspective on the poverty debate. Canadian Council on Social, 1999.
[7] M. Cooper, “Housing affordability: a children’s issue,” in CPRN Discussion Paper F/11). Ottawa: Canadian Policy Research Networks, 2001.
[8] G. W. Evans and L. A. Marcynyszyn, “Environmental justice, cumulative environmental risk, and health among low- and middle-income children in upstate New York.,” American journal of public health, vol. 94, no. 11, pp. 1942–1944, Nov. 2004.
[9] T. Jelleyman and N. Spencer, “Residential mobility in childhood and health outcomes: a systematic review.,” Journal of epidemiology and community health, vol. 62, no. 7, pp. 584–592, Jul. 2008.
[10] S. E. Gilman, I. Kawachi, G. M. Fitzmaurice, and L. Buka, “Socio-economic status, family disruption and residential stability in childhood: relation to onset, recurrence and remission of major depression.,” Psychological medicine, vol. 33, no. 8, pp. 1341–1355, Nov. 2003.
[11] R. Cohen and K. Wardrip, Should I stay or should I go?: exploring the effects of housing instability and mobility on children. Center for Housing Policy, 2011.
[12] C. D. Solari and R. D. Mare, “Housing crowding effects on children’s wellbeing.,” Social science research, vol. 41, no. 2, pp. 464–476, Mar. 2012.
[13] A. Voight, M. Shinn, and M. Nation, “The longitudinal effects of residential mobility on the academic achievement of urban elementary and middle school students,” Educational Researcher, vol. 41, no. 9, pp. 385–392, 2012.
[14] American Public Health Association (APHA), “Housing and Homelessness as a Public Health Issue,” American Public Health Association, 07-Nov-2017. [Online]. Available: https://www.apha.org/policies-and-advocacy/public-health-policy-statements/policy-database/2018/01/18/housing-and-homelessness-as-a-public-health-issue.
[15] R. Henderson, “Homelessness is a public health crisis,” The Guardian, 22-Jul-2014. [Online]. Available: https://www.theguardian.com/society-professionals/2014/jul/22/homelessness-public-health-crisis. [Accessed: 05-Sep-2018].
[16] National Health Care for the Homeless Council, “Homelessness and Health: What’s the Connection,” National Health Care for the Homeless Council, Jun. 2011.
[17] J. Lubell, R. Morley, M. Ashe, L. Merola, and J. Levi, “Housing and health: New opportunities for dialogue and action,” Washington, DC: National Center for Healthy Housing, 2011.
[18] P. Braveman, M. Dekker, S. Egerter, T. Sadegh-Nobari, and C. Pollac, “Exploring the social Determinants of Health: Housing and Health.” Robert Wood Johnson Foundation, May-2011.
[19] “Regional Housing Need Allocation,” Association of Bay Area Governments. [Online]. Available: https://abag.ca.gov/planning/housingneeds/. [Accessed: 24-Aug-2018].
[20] K. R. Manturuk, M. R. Lindblad, and R. G. Quercia, A Place Called Home: The Social Dimensions of Homeownership. Oxford University Press, 2017.
[21] “Eviction Protection 2.0,” San Francisco Tenants Union. [Online]. Available: https://www.sftu.org/eviction-protection-2-0-summary/. [Accessed: 24-Aug-2018].
[22] Applied Survey Research, “2017 San Francisco Homeless Count & Survey Comprehensive Report,” San Francisco, CA, 2017.
