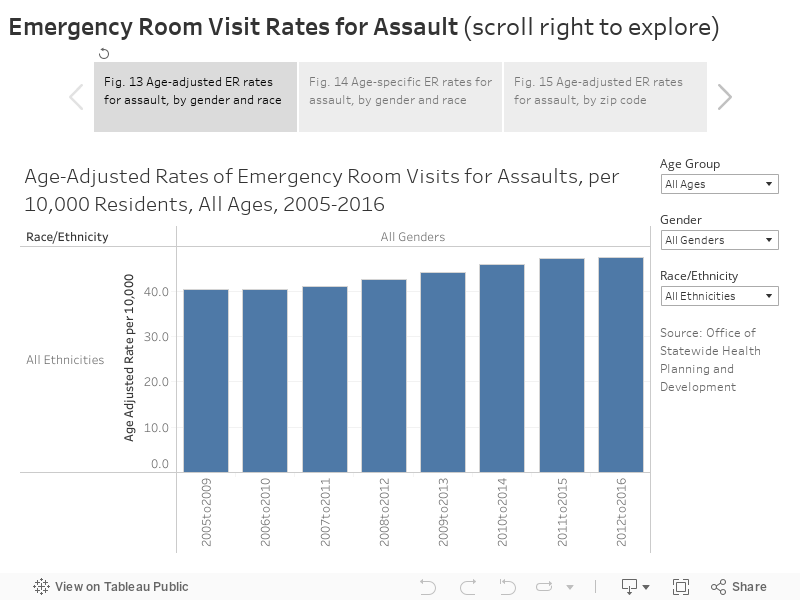
Assault: Between 2005-2016, there appears to have been a slight increase in the age-adjusted rate of emergency room visits for assault, from 40.3 during 2005-2009 to 47.5 in 2012-2016 (Figure 13). This increase is more pronounced for adults alone, while youth experienced a decrease in their ER visit rate for assault. The visit rate for males is about twice the rate for females. By ethnicity, Black San Franciscan’s have by far the highest visit rate for assault – 255 per 10,000 compared to 13 for Asian residents and 36 for White residents. Pacific Islanders have the second highest rate at 131. The disparity between males and females is also lower for Black and Pacific Islander residents. While the visit rates for Asian, Latino, and White males are about twice as high as the rates for females, the rate for Black men is only 1.29 times higher and for Pacific Islander the rates are nearly the same.
When the visit rate is calculated for specific age groups, transitional aged youth (18-24 years) have the highest rate among both males and females (Figure 14). When examined by race, 25-34 year-old Black adults have the highest rate for their ethnicity (447), while 45-54 year old Pacific Islanders have the highest rate within their ethnic group (270). The zip codes with the highest rates of residents being admitted to the ER for assault are 94102 (Tenderloin), 94103 (SOMA), and 94124 (Bayview) (Figure 15). When examined just for youth, 94124 have by far the highest rate.
What is currently being done in San Francisco to improve health?
In 2014 SFUSD completed a Memorandum of Understanding limiting police presence on school campuses {35} and the board of education adopted a resolution to end suspensions for “willful defiance” which accounted for more than 80% of suspension of Black and Latinx students. [36].
Data Sources
SFPD San Francisco Police Department. https://data.sfgov.org/Public-Safety/Police-Department-Incident-Reports-Historical-2003/tmnf-yvry
SFC San Francisco Controller’s Office, “San Francisco City Survey,” http://sfcitysurvey.weebly.com/
UCB University of California at Berkeley, “California Child Welfare Indicators Project.” http://cssr.berkeley.edu/ucb_childwelfare/allegations.aspx
YRBS “Youth Risk Behavior Surveillance survey,” http://www.cdc.gov/healthyyouth/data/yrbs/index.htm
SFJPD San Francisco Juvenile Probation Department, “2017 Statistical Report,” https://sfgov.org/juvprobation/sites/default/files/2017AnnualReport_Statistics.pdf
OSHPD Office of Statewide Health Planning and Development. http://www.oshpd.ca.gov/
Methods and Limitations
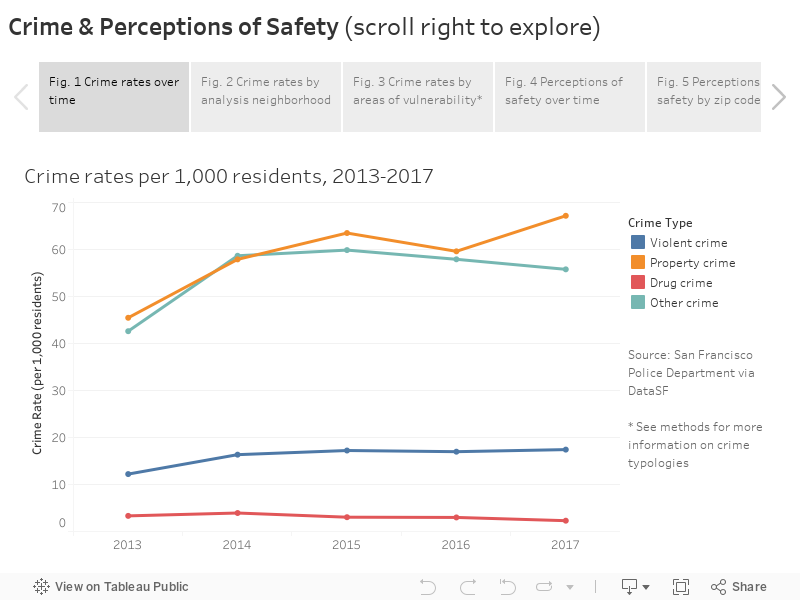
Violent crime and drug crime: Crime rates are calculated based only on crimes that are reported to the San Francisco Police Department. Violent crime includes 1) forcible sexual offenses, 2) robbery, and 3) assault. Homicide data is excluded, because it was not publicly available. Property crimes included 4) burglary, 5) larceny/theft, 6) vehicle theft, and 7) arson. Drug crimes include incidents coded as 8) drug/narcotic. All other crimes fall in the “other” category. Because crime incidents may include multiple crime categories, incidents were coded with the most severe crime category listed (1-8 listed previously).
Perceived safety: San Francisco City Survey respondents were asked to categorize their level of safety as very safe, safe, neither safe nor unsafe, unsafe, or very unsafe when walking alone in their neighborhood during the day or night. In 2015, the survey methodology changed from mail to phone in order to reach a more representative sample of San Francisco residents. This included changes to ethnic groupings – in 2015 Pacific Islanders (previously included in Asian) and Middle Eastern became distinct groups. Thus, prior to 2015, Asian should be interpreted as Asian/Pacific Islander. Because of these methodological changes, data before and after 2015 should be compared with caution.
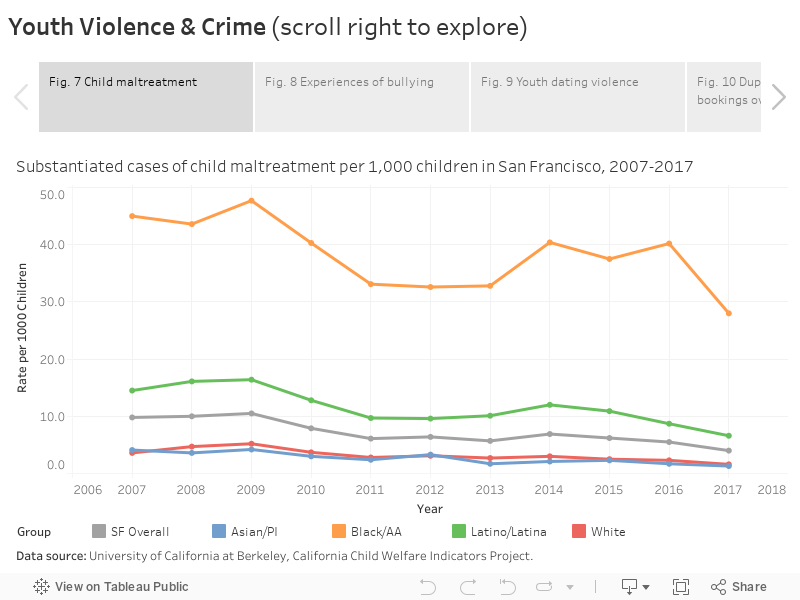
Substantiated child abuse: Rates of substantiated child maltreatment includes cases of physical, sexual, and emotional abuse, as well as child neglect, exploitation, caretaker absence/incapacity, at-risk siblings, and allegations of substantial risk. Rates were calculated per 1,000 children using CA Department of Finance population estimates.
Bullying: Students were asked the following questions: 1) During the past 12 months, have you ever been bullied on school property? 2) During the past 12 months, have you ever been electronically bullied?
Dating violence: Students were asked the following question: during the past 12 months, how many times did someone you were dating or going out with physically hurt you on purpose? The denominator for dating violence rates is the number of youth that dated someone in the past 12 months.
Juvenile Hall Bookings: Juvenile hall bookings indicate that a youth (<18 years) was detained for a criminal offense. Both duplicated and unduplicated juvenile hall bookings are presented. Duplicated bookings count each booking instance, even if it is for the same youth. Unduplicated counts each youth only once, even if they are booked multiple times.
Emergency room visits due to assault: Emergency room visits among San Francisco Residents due to assault were identified with the following list of primary injury code (E-Codes): E960, E961, E962, E963, E964, E965, E966, E967, E968.
Hospitalizations and Emergency Room Visits:
Hospitalization and ER rates measure the number of admissions or visits, not the number of residents who are hospitalized. Admissions records may include multiple admissions by the same person.
In October 2015, the diagnosis coding standard for Hospitalizations and Emergency Room visits was changed from ICD-9 to ICD-10. Caution should be used in comparing data using the two different standards.
ICD-9 and ICD-10 codes for assault were obtained from the CDPH Safe and Active Communities Branch [19]. Records with ICD-9 code E967 or ICD-10 codes Y060, Y061, or Y07 indicated domestic abuse.
Estimates for assault as the primary cause were obtained by searching the primary diagnosis field only while estimate for assault as the primary, co-morbid, or coexisting cause was obtained by searching all available diagnosis fields. Similarly, A primary diagnosis of domestic abuse was defined as an assiciated code in the primary diagnosis field or, where assault was the primary diagnosis, in any diagnosis field. A domestic abuse code in any diagnosis filed, regardless of assault as the primary cause, indicated domestic abuse as primary, co-morbid or co-existing.
Population estimates for rates:
- State of California, Department of Finance, Race/Hispanics Population with Age and Gender Detail, 2000–2010. Sacramento, California, September 2012.
- California Department of Finance. Demographic Research Unit. 2018. State and county population projections 2010-2060 [computer file]. Sacramento: California Department of Finance. February 2017.
Standard Population for age adjustment:
- Population Projections of the United States by Age, Sex, Race, and Hispanic Origin: 1995 to 2050. U.S. Department of Commerce, Economics and Statistics Administration, BUREAU OF THE CENSUS
References
[1] Prevention Institute. A lifetime commitment to violence prevention: The alameda county blueprint. Technical report, 2005.
[2] JD Bell, J Bell, R Colmenar, R Flournoy, M McGehee, V Rubin, M Thompson, J Thompson, and VB Vasquez. Reducing health disparities through a focus on communities. Oakland, CA: PolicyLink, 2002.
[3] A M Perez-Smith, K E Albus, and M D Weist. Exposure to violence and neighborhood affiliation among inner-city youth. Journal of clinical child psychology, 30:464–472, December 2001.
[4] Emily J Ozer and Kristen L McDonald. Exposure to violence and mental health among chinese american urban adolescents. The Journal of adolescent health : official publication of the Society for Adolescent Medicine, 39:73–79, July 2006.
[5] Diann M Ackard and Dianne Neumark-Sztainer. Date violence and date rape among adolescents: associations with disordered eating behaviors and psychological health. Child abuse & neglect, 26:455–473, May 2002.
[6] Donna E Howard and Min Qi Wang. Psychosocial correlates of u.s. adolescents who report a history of forced sexual intercourse. The Journal of adolescent health : official publication of the Society for Adolescent Medicine, 36:372–379, May 2005.
[7] Mindy Thompson Fullilove, Veronique Heon, Walkiria Jimenez, Caroline Parsons, Lesley L Green, and Robert E Fullilove. Injury and anomie: effects of violence on an inner-city community. American Journal of Public Health, 88(6):924–927, 1998.
[8] R J Sampson, S W Raudenbush, and F Earls. Neighborhoods and violent crime: a multilevel study of collective efficacy. Science (New York, N.Y.), 277:918–924, August 1997.
[9] Putnam R. Bowling Along: The Collapse and Revival of the American Community. New York,. NY: Simon & Schuster, 2000.
[10] B P Kennedy, I Kawachi, D Prothrow-Stith, K Lochner, and V Gupta. Social capital, income inequality, and firearm violent crime. Social science & medicine (1982), 47:7–17, July 1998.
[11] Robert J Sampson and Stephen W Raudenbush. Neighborhood stigma and the perception of disorder. Focus, 24(1):7–11, 2005.
[12] Pamela Wilcox Rountree and Kenneth C Land. Perceived risk versus fear of crime: Empirical evidence of conceptually distinct reactions in survey data. Social forces, pages 1353–1376, 1996.
[13] Andrea Altschuler, Carol P Somkin, and Nancy E Adler. Local services and amenities, neighborhood social capital, and health. Social science & medicine, 59(6):1219–1229, 2004.
[14] Mahasin S Mujahid, Ana V Diez Roux, Jeffrey D Morenoff, Trivellore E Raghunathan, Richard S Cooper, Hanyu Ni, and Steven Shea. Neighborhood characteristics and hypertension. Epidemiology, 19(4):590–598, 2008.
[15] Sarah Foster and Billie Giles-Corti. The built environment, neighborhood crime and constrained physical activity: an exploration of inconsistent findings. Preventive medicine, 47(3):241–251, 2008.
[16] Kristina Sundquist, Holger Theobald, Min Yang, Xinjun Li, Sven-Erik Johansson, and Jan Sundquist. Neighborhood violent crime and unemployment increase the risk of coronary heart disease: a multilevel study in an urban setting. Social science & medicine, 62(8):2061–2071, 2006.
[17] Jacqueline Kerr, Dori Rosenberg, James F Sallis, Brian E Saelens, Lawrence D Frank, Terry L Conway, et al. Active commuting to school: associations with environment and parental concerns. Medicine and science in sports and exercise, 38(4):787, 2006.
[18] Toms Augustin, Thomas A Glass, Bryan D James, and Brian S Schwartz. Neighborhood psychosocial hazards and cardiovascular disease: the baltimore memory study. American Journal of Public Health, 98(9):1664–1670, 2008.
[19] California Department of Public Health, Safe and Active Communities Branch, Cause of Injury Definition Codes
2017. https://www.cdph.ca.gov/Programs/CCDPHP/DCDIC/SACB/Pages/EpiCenter/OverviewofICDE9and10codes.aspx