Variables
- VOTER TURNOUT
- NEIGHBORHOOD BLOCK PARTIES
- ADULTS WHO MET INFORMALLY WITH OTHERS TO DEAL WITH COMMUNITY PROBLEMS
- ADULTS WHO SERVED AS A VOLUNTEER ON ANY LOCAL BOARD, COUNCIL, OR ORGANIZATION THAT DEALS WITH COMMUNITY PROBLEMS
According the American Psychological Association, civic participation is defined as “individual and collective action designed to identify and address issues of public concern.”[1] It can include efforts to directly address an issue, collaboration with other community members to solve a problem, or interaction with the institutions of representative democracy. The indicators included here, measure volunteer service and community organization involvement and voting patterns.
Civic participation influences the health of the community in various ways. Most acutely, civic participation can affect community members through the implementation of social or economic policies that are passed by elected officials, city boards, or voted on directly.[2] Disparities in demographic representation among elected officials, city boards, and those voting may impact political outcomes and resulting policies, with disparate impacts among residents. For example, lower representation of poorer voters could result in reductions in funding for social programs. Individuals who volunteer have been found to have lower mortality rates, greater functional ability and lower rates of depression later in life compared to those who do not volunteer.[3] In general, civic participation can be an indirect measure of social capital.3 Studies have documented positive associations between social capital and both lower mortality rates and higher health ratings.[4, 5]
Many interrelated factors impact whether individuals engage in civic activities. With regards to participation in elections, these can include educational attainment, income or class, race/ethnicity, family history of voting, age, language spoken, trust in government, access to transportation and childcare, exposure to get-out-the-vote mobilization efforts, awareness of candidate and ballot initiatives, clarity (or lack of clarity) or ballot initiative language, and so on. Similarly, participation in civic committees or volunteer organizations is also influenced by numerous factors. Resources like income, wealth, education and health as well as high levels of social and cultural capital enable volunteering, while low levels of resources and capital hinder it. [6]
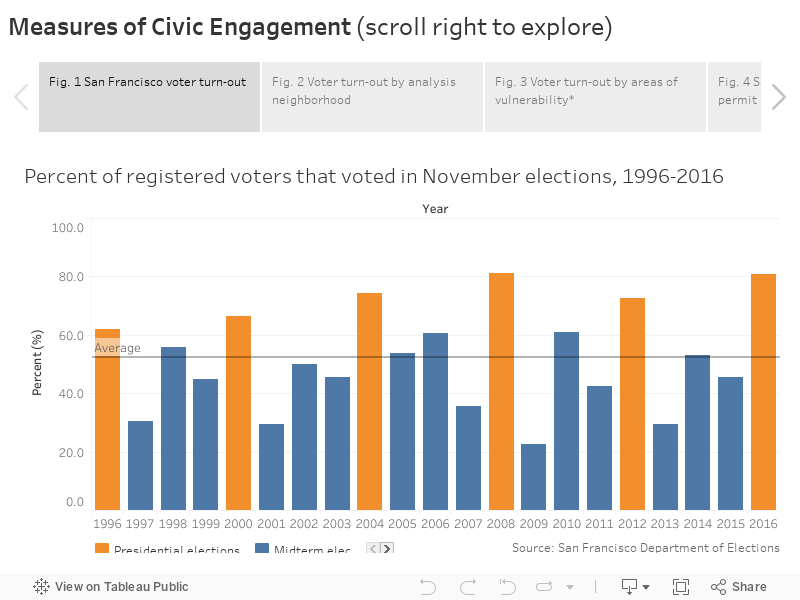
Voter Turnout: Between the years of 1996 and 2016, the percent of registered voters that voted in November elections was 52%, with the average being 73% for presidential elections and 44% for midterm elections (See Figure 1). The 2012 and 2016 presidential elections recorded the highest election turnout over the past 20 years, with more than 80% of registered voters participating. Voter turnout is not even across all neighborhoods in San Francisco. Chinatown, Tenderloin, Bayview, and Visitacion Valley often have the lowest turnout, while the wealthier central neighborhoods have consistently higher turnout (Figure 2). When examined by Areas of Vulnerability (a measure of the geographic density of socioeconomic disadvantage), parts of the city that are designated an area of vulnerability have a consistently lower voting rate in all elections (Figure 3).
Block Parties: Another spatial measure of civic and community engagement is the number of block parties (with special event street closure permits from the MTA) per square mile. Since 2014, there has been a citywide increase in the number of block parties (Figure 4). When examined by analysis neighborhood, more affluent neighborhoods including Bernal Heights, Glen Park, Noe Valley, Lone Mountain, and Seacliff have the highest density of block parties (Figure 5). Areas of the city that are not designated as an Area of Vulnerability (AOV) also have a block party density typically about three times as high as area that are designated as an AOV (Figure 6).
Meeting and Volunteering to Address Community Problems: On average, about 20% of San Francisco adults report that they meet informally with others to address community problems (Figure 7). Between the years of 2011-2016, 10-14% of adults volunteered with a group to address community problems. For both measures, no significant differences were apparent when data was stratified by time, gender, age, income, or ethnicity.
SFDOE San Francisco Department of Elections.
http://ask.chis.ucla.edu/main/default.asp
SFMTA San Francisco Metropolitan Transportation Agency, Special Event Street Closures.
https://www.sfmta.com/permits/special-event-street-closures#Neighborhood
CHIS UCLA Center for Health Policy Research, “California Health Interview Survey”.
https://sfelections.sfgov.org/results
Voter turnout: Voter turnout was calculated by dividing the number of persons that voted by the number of registered voters. For summarization by analysis neighborhoods and Areas of Vulnerability, voting precincts were assigned to the larger geography that their centroid fell within.
In California, eligible voters are people who are citizens of the United States; residents of California; 18 years of age or older on Election Day; not in prison, on parole, serving a state prison sentence in county jail, serving a sentence for a felony pursuant to subdivision (h) of Penal Code section 1170, or on post release community; and not found by a court to be mentally incompetent.
Statistical instability: Statistically unstable estimates are not shown in this document. Statistical instability may arise from:
…few respondents to a survey,
…small population sizes, or
…small numbers of affected individuals.
Statistical instability indicates a lack of confidence in an estimates ability to accurately and reliably represent the population. Due to statistical instability, estimates are not available for all age, gender, ethnicity, or other groups.
Areas of Vulnerability: Areas of Vulnerability (AOV) were created as a way to examine geographic data in relation to populations of concentrated socioeconomic disadvantage. The criteria to be designated as an AOV were:
Tracts that had unstable data for an indicator were automatically given zero credit for that indicator.
[1] American Psychological Association. Civic participation. http://www.apa.org/education/undergrad/civic-engagement.aspx.
[2] Healthy Communities Data California Department of Public Health and Indicators Project (HCI). Voter registration and participation. https://data.chhs.ca.gov/dataset/voter-registration-2002-2010/resource/fe57363f-07fa-42bc-aabc-4291e6b3babb, 2014.
[3] Corporation for National, Community Service (US). Office of Research, and Policy Development. The health benefits of volunteering: A review of recent research. Corporation for National and Community Service, Office of Research and Policy Development, 2007.
[4] Daniel Kim and Ichiro Kawachi. A multilevel analysis of key forms of community- and individual-level social capital as predictors of self-rated health in the united states. Journal of urban health : bulletin of the New York Academy of Medicine, 83:813–826, September 2006.
[5] Steven Cummins, Mai Stafford, Sally Macintyre, Michael Marmot, and Anne Ellaway. Neighbourhood environment and its association with self rated health: evidence from scotland and england. Journal of epidemiology and community health, 59:207–213, March 2005.
[6] Rene Bekkers and A De Wit. Participation in volunteering: What helps and hinders. Amsterdam, Netherlands: VU University Amsterdam, Department of Philanthropic Studies, ITSSOIN Project, 2014.
