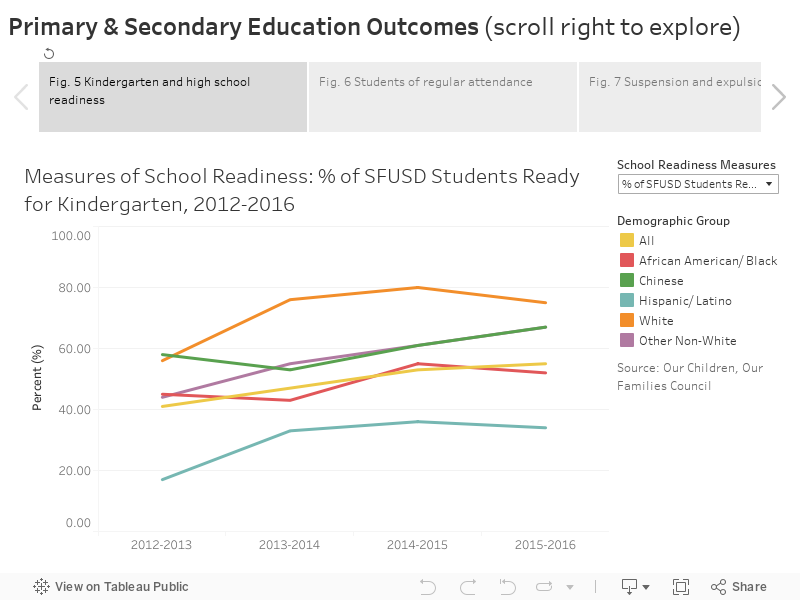
School readiness amongst kindergarteners and 9th grade students: Between 2012 and 2016 there was an increase in the percentage of incoming kindergarten students who tested as “ready” for school, from 41% to 55% (Figure 5).[16] Increases we more moderate for high school students, increasing from 63% to 66% between 2014 and 2016. Latino/a and African American students had the lowest readiness rates for both kindergarten and high school.
School attendance: Chronic absenteeism is defined as missing more than 15 days of school in a year. Here we define “regular school attendance” as not being chronically absent. Between the 2014-2015 school year and the 2016-2017 school year the number of students with regular attendance dropped from 91% to 89% (Figure 6). A decrease was seen among most demographic groups; however, African American students have notably lower regular attendance rates that other groups.
Suspension and expulsion rates: Overall rates for suspension and expulsion in San Francisco public schools have decreased since the 2012–13 school year (Figure 7). However, suspension rates differ by gender and ethnicity. Male students have a suspension rate of 2% while female students have a rate of 1%. Likewise, African American and Pacific Islander students have a suspension rates over 5% while the rate for Asian students was less than 1%. While the race-ethnic distribution of students in SFUSD varies greatly from that of the general population in San Francisco, data suggests Black/African American and Latino/a students are being suspended or sent out of the class room by teachers (classroom referrals) at disproportionately high rates. At SFUSD schools during the 2016-17 school year, nearly 40 percent of all students who received at least one suspension were Black/African American, despite making up only 11 percent of the student population.
Elementary year metrics — third grade students who do NOT meet state standards for English language arts: Each year California public school student students participate in state standardized testing for English language arts/literacy and math. As mentioned above, third grade reading proficiency is often considered a predictor of lifetime educational outcomes. According to the California Assessment of Student Progress and Performance (CAASPP) website, students that fall into the category of “Standard Not Met” for English language arts “[need] substantial improvement to demonstrate the knowledge and skills in English language arts/literacy needed for likely success in future coursework.”[19] When examined by ethnicity, 60% of Black/African American and 45% of Latino third grade students did not meet state standards in the 2016-17 school year, compared to 11% of White and 14% of Asian third-grade students students (Figure 8). Black and Latino/a students are also faring slightly worse in San Francisco than their counterparts in California (48% and 40% percent, respectively). Poorer performance for San Francisco’s Black and Latino/a children exists despite San Francisco having an overall lower percentage of children who do not meet state standards than California (27% vs. 32%). Grouped by socioeconomic status, 31% of non-economically disadvantaged students failed to meet state standards while 38% of economically disadvantaged third graders missed the same mark.
High school graduation: The 2015-16 school year high school graduation rate in San Francisco was 87% (Figure 8). As with other education measures, there is great variation in graduation rates by demographics. 95% of Asian students in 2015-16 cohort graduated, while 71% of Black students graduated. There has been a modest increase in graduation rates for all students – from 82% in 2012 to 87% in 2016 – though rates for Black students remained the same at 71%. Pacific Islander and Latino/a students saw notable increases between 2012 and 2016.
What is currently being done in San Francisco to improve health?
Data Sources
ACS American Community Survey, 5-year data
https://factfinder.census.gov/faces/nav/jsf/pages/index.xhtml
CDE California Department of Education. http://dq.cde.ca.gov/dataquest/
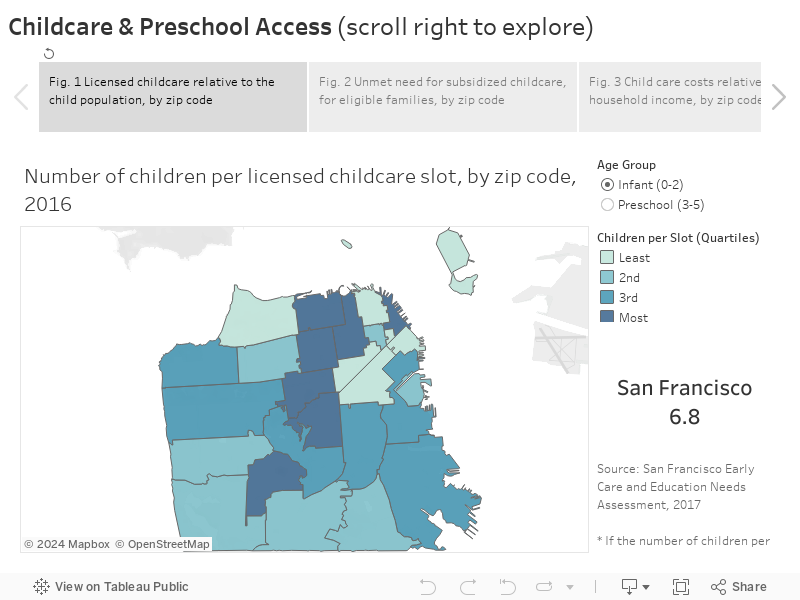
CPAC Child Care Planning & Advisory Council. Early Care & Education Community Needs Assessment. http://sfcpac.org/ece-resources/community-partner-resources/
OCOFC Data Report for Our Children, Our Families Council. 2017 http://www.ourchildrenourfamilies.org/ocof-evaluation-report-year-1/
SFUSD San Francisco Unified School District. http://web.sfusd.edu/Services/research_public/201617%20District%20Data%20Summary%20Newsletters/Forms/AllItems.aspx
Methods and Limitations
Statistical instability: Statistically unstable estimates are not shown in this document. Statistical instability may arise from:
…few respondents to a survey,
…small population sizes, or
…small numbers of affected individuals.
Statistical instability indicates a lack of confidence in an estimates ability to accurately and reliably represent the population. Due to statistical instability, estimates are not available for all age, gender, ethnicity, or other groups.
Areas of Vulnerability: Areas of Vulnerability (AOV) were created as a way to examine geographic data in relation to populations of concentrated socioeconomic disadvantage. The criteria to be designated as an AOV were:
1) Top 1/3rd of tracts for < 200% poverty or < 400% poverty & top 1/3rd for persons of color OR
2) Top 1/3rd of tracts for < 200% poverty or < 400% poverty & top 1/3rd for youth or seniors (65+) OR
3) Top 1/3rd of tracts for < 200% poverty or < 400% poverty & top 1/3rd for 2 other categories (unemployment, completing high school or less, limited English proficiency persons, linguistically isolated households, or disability)
Tracts that had unstable data for an indicator were automatically given zero credit for that indicator.
References
[1] World Health Organization (WHO), Closing the gap in a generation: health equity through action on the social determinants of health: Commission on Social Determinants of Health final report. World Health Organization, 2008.
[2] American Public Health Association (APHA), Public health and education: working collaboratively across sectors to improve high school graduation as a means to eliminate health disparities.(Policy 20101). 2010.
[3] “The milestones of your little rocket scientist’s development,” Early Childhood Education Degrees, 2018-2012. [Online]. Available: https://www.early-childhood-education-degrees.com/milestones/.
[4] L. A. Karoly, M. R. Kilburn, and J. S. Cannon, Early childhood interventions: Proven results, future promise. Rand Corporation, 2006.
[5] L. J. Schweinhart, The High/Scope Perry Preschool study through age 40: Summary, conclusions, and frequently asked questions. High/Scope Educational Research Foundation, 2004.
[6] City, County of San Francisco, and San Francisco Unified School District (Prepared by Social Policy Research Associates), “Data report for our children, our families council,” 2015.
[7] “Impact of health on education,” Schools and Health, 2015. [Online]. Available: http://www.schoolsandhealth.org/Pages/HealthonEducation.aspx.
[8] Y.-Y. Meng, S. H. Babey, and J. Wolstein, “Asthma-related school absenteeism and school concentration of low-income students in California.,” Preventing chronic disease, vol. 9, p. E98, 2012.
[9] “Educational attainment: Indicators on children and youth,” Child Trends Data Bank, 2013. [Online]. Available: http://www.childtrends.org/wp-content/uploads/2012/07/06_Educational_Attainment.pdf.
[10] “High school dropout rates: Indicators on children and youth,” Child Trends Data Bank, 2013. [Online]. Available: http://www.childtrends.org/wp-content/uploads/2014/10/01_Dropout_Rates.pdf.
[11] M. A. Winkleby, D. E. Jatulis, E. Frank, and S. P. Fortmann, “Socioeconomic status and health: how education, income, and occupation contribute to risk factors for cardiovascular disease.,” American journal of public health, vol. 82, no. 6, pp. 816–820, Jun. 1992.
[12] C. C. Raver and J. Knitzer, “Ready to enter: What research tells policymakers about strategies to promote social and emotional school readiness among three-and four-year-olds,” 2002.
[13] “Impact of education on health,” Schools and Health, 2015. [Online]. Available: http://www.schoolsandhealth.org/Pages/EducationonHealth.aspx.
[14] D. J. Hernandez, “Double Jeopardy: How Third-Grade Reading Skills and Poverty Influence High School Graduation.,” Annie E. Casey Foundation, 2012.
[15] “10 facts about school attendance,” Attendance Works, 2014. [Online]. Available: http://www.attendanceworks.org/facts-stats-school-attendance/.
[16] San Francisco Child Care Planning & Advisory Council, “San Francisco Early Care and Education Needs Assessment,” resreport, 2017.
[17] California Department of Education, “2016 Regional Market Rate Survey of California Child Care Providers,” 2017.
[18] California Department of Education, “Individualized County Child Care Subsidy Plan,” 17-Oct-2017. [Online]. Available: https://www.cde.ca.gov/sp/cd/ci/icccsubsidyplan.asp.
[19] California Department of Education, “Understanding California Assessment of Student Progress and Performance (CAASPP) Summary Reports,” California Assessment of Student Progress and Performance (CAASPP). [Online]. Available: https://caaspp.cde.ca.gov/sb2017/UnderstandingCAASPPReports#a.